Slovenian Economic Mirror
Slovenian Economic Mirror 6/2025
The available economic indicators for Slovenia in recent months point to several positive developments in the export sector. Manufacturing output has been strengthening across all groups of industries by technological intensity since mid-year. Nevertheless, after the first eight months, it remained slightly below the level recorded in the same period last year. Total orders in manufacturing also remained at a low level in September, while production expectations improved slightly. Goods exports and imports (excluding operations involving processing) fell on a monthly basis in August, following real growth in July. On average over the first eight months of the year, exports declined year-on-year, while imports remained broadly unchanged. After declining in the second half of 2024, Slovenia’s goods export share in the EU market has stabilised on a quarter-on-quarter basis this year, though it remained slightly lower year-on-year in the first half of 2025. Activity growth in construction strengthened in the third quarter, while growth in household consumption, according to various indicators, moderated during this period. Economic sentiment improved further in September and was also higher than in the same month last year. Following the decline at the end of last year, the number of persons in employment remained broadly unchanged up to August this year, while the number of unemployed increased for the third consecutive month in September amid a higher inflow of citizens with temporary protection status. Year-on-year inflation eased slightly in September. The largest upward contribution to inflation continued to come from higher prices of food and non-alcoholic beverages.
Composite Purchasing Managers’ Index (PMI) for the euro area, September 2025
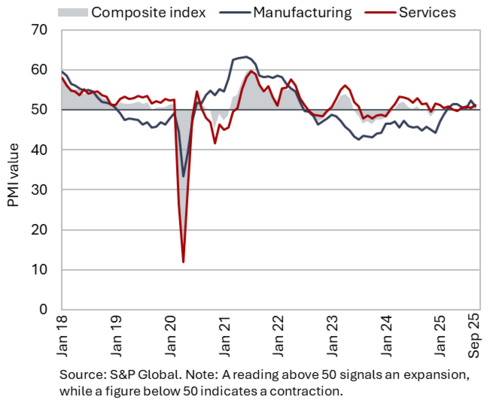
Economic sentiment indicators for the third quarter point to continued activity growth in both the euro area and Germany, Slovenia’s main trading partner. In September, the composite Purchasing Managers’ Index (PMI) for the euro area reached its highest level since May 2024 (51.2). The quarterly average (51.0) likewise indicated an expansion in overall activity. The services PMI strengthened in September (51.3), while the manufacturing PMI declined slightly but remained above 50 (the threshold between growth and contraction). Germany’s composite PMI rose in September to its highest level in 16 months, and the third quarter average likewise pointed to rising activity. The Economic Sentiment Indicator (ESI) for the euro area improved slightly in September, reflecting stronger confidence among consumers and in the construction sector. On average, the indicator in the third quarter was higher than in the second quarter, but it remained lower year-on-year. The Ifo Business Climate Index for Germany declined in September but, on average, was higher in the third quarter than in the preceding quarter.
IMF’s economic outlook, October 2025
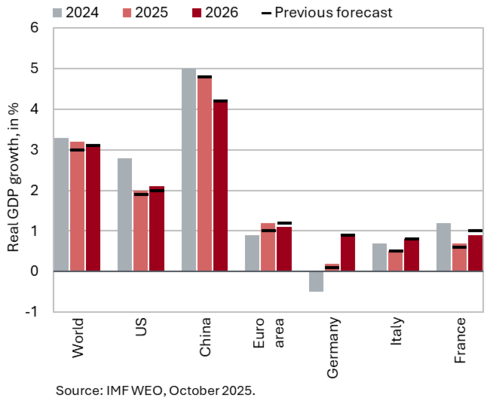
In October, the IMF revised its global growth projection for 2025 slightly upwards. It is now projected to reach 3.2%, and 3.1% in 2026 (after 3.3% last year). Compared with the July forecast, the projection for 2025 was revised up by 0.2 p.p., while the forecast for 2026 remains unchanged. World trade volume is expected to expand significantly more than the IMF anticipated in the spring or summer forecasts (by 3.6%), boosted by front-loading of exports ahead of the introduction of new US tariffs. Next year, global trade growth is expected to moderate to 2.3%. For the United States, the 2025 growth forecast was revised up by 0.1 p.p. to 2.0%, with activity expected to remain broadly stable in 2026. China has so far not been significantly affected by the high US tariffs, as it has redirected its exports toward Asian and European partners. The IMF projects growth in China to reach 4.8% this year and 4.2% next year (the same as in July). For the euro area, the 2025 growth outlook was revised upward by 0.2 p.p. to 1.2%, while the 2026 forecast was adjusted slightly downward by 0.1 p.p. to 1.1%. Growth is expected to be supported primarily by private consumption, driven by rising real wages and expansionary fiscal policy (particularly in Germany). In Germany, growth is projected to remain subdued in 2025 (0.2%), before recovering more noticeably next year (to 0.9%) amid expansionary fiscal policy. The realisation of these forecasts is subject to exceptionally high uncertainty, particularly regarding US foreign trade policy. In addition, increased fiscal vulnerabilities in major advanced economies could lead to heightened financial market volatility and adverse spillovers to the global economy.
Commodity prices, September 2025
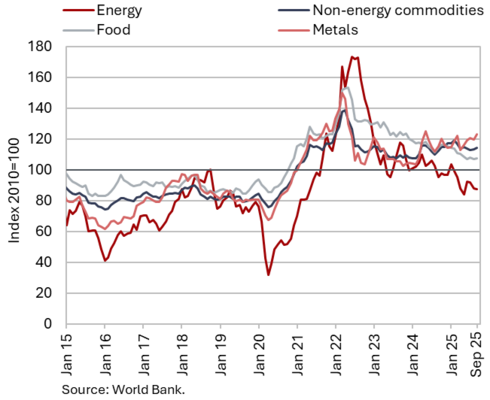
Brent crude oil prices remained broadly unchanged on average in September compared with August, while non-energy commodity prices rose slightly. The average dollar price of Brent crude oil rose marginally by 0.1% to USD 67.99, while the euro price declined by 0.7% to EUR 57.95. Oil prices in the third quarter were the lowest since the second quarter of 2021. The relatively low price level reflects, among other factors, the OPEC+ decision to raise production quotas. Year-on-year, the price of oil was 8.2% lower in US dollars and 13.1% lower in euros. The average euro price of natural gas on the European market (Dutch TTF) fell for the third consecutive month in September (by 0.8%, to EUR 32.34/MWh) amid high storage levels in Europe, reaching its lowest level in nearly a year and a half. Year-on-year, the price was 20.6% lower. According to the World Bank, the average dollar price of non-energy commodities increased in September both month-on-month and year-on-year (by 0.9% and 1.9% respectively). Month-on-month, metals saw the largest price increase, whereas year-on-year the strongest increases were recorded for fertilisers and beverage raw materials.
Effective exchange rate, Q2 (REER ulc) and Q3 2025 (REER hicp, ppi)
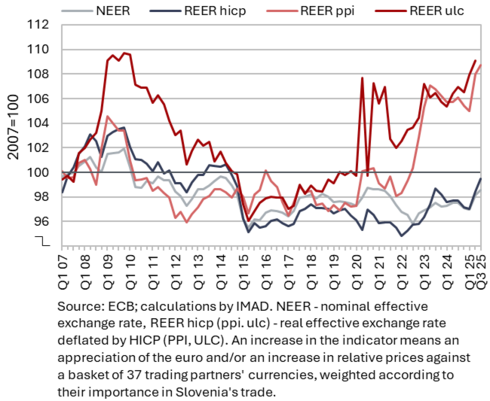
The deterioration in cost competitiveness observed in the first half of the year was accompanied by a weakening of price competitiveness indicators around mid-year. Cost competitiveness (REER ulc) had been gradually deteriorating for most of 2024, mainly due to strong growth in (nominal) unit labour costs (NULC) in the construction sector. In the first half of 2025, however, NULC growth across business sector activities (driven by stagnating productivity growth) was most pronounced in manufacturing and market services. Compared with the EU, Slovenia recorded particularly high growth in manufacturing NULC, although the increase remained below the average observed in the Visegrad countries. The price competitiveness indicators (REER ppi, hicp) deteriorated in the second and third quarters of this year, following a gradual improvement after the energy crisis. In addition to the appreciation of the euro (NEER growth), this was also driven by faster price growth (PPI and HICP) in Slovenia compared with its trading partners.
Short-term indicators of economic activity in Slovenia, July–August 2025
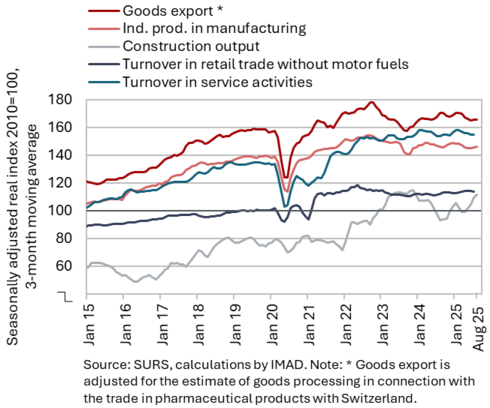
The available economic indicators for Slovenia in recent months point to some positive developments in the export sector, while activity in construction and household consumption are higher year-on-year. Manufacturing output has been strengthening across all groups of industries by technological intensity (seasonally adjusted) since mid-year; however, after the first eight months, it was 1% lower year-on-year. Goods exports and imports (excluding operations involving processing) declined month-on-month in August after real growth in July and were also lower year-on-year. On average, in the first eight months of the year, exports were lower year-on-year, while imports remained broadly unchanged compared with the same period last year. Construction activity declined slightly in August, while on a year-on-year basis it was higher by one quarter, reflecting an increase in the value of all types of construction work. It was also higher than a year earlier in the first eight months of the year. Total real turnover in market services declined further in July after contracting in the second quarter and was roughly at the same level as in the same month last year. In the first seven months, year-on-year growth in turnover was recorded only in transportation and storage as well as in professional and technical activities. Despite weaker performance in most sectors in July, turnover in trade remained higher year-on-year across all sectors in the first seven months of the year. The nominal value of fiscally verified invoices (a proxy for sales) was 3% higher year-on-year in the third quarter (following year-on-year stagnation in the first quarter and 5% growth in the second quarter).
Electricity consumption by consumption group, September 2025
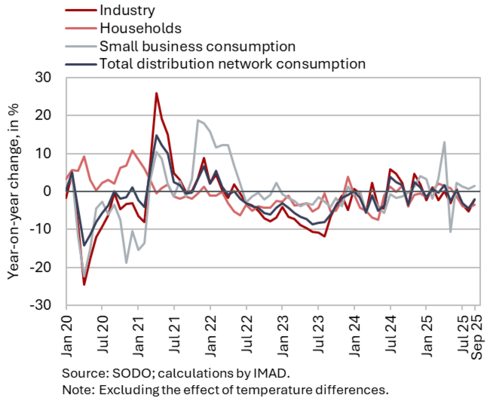
Electricity consumption in the distribution network was 2.2% lower year-on-year in September. With one more working day this September, industrial consumption, which can serve as an indicator of economic activity, was 2.1% lower year-on-year and household consumption was 3.4% lower. Small business consumption was 1.4% higher year-on-year. In the third quarter, industrial consumption was 3.6% lower year-on-year, with the same number of working days.
Trade in goods – real, August 2025
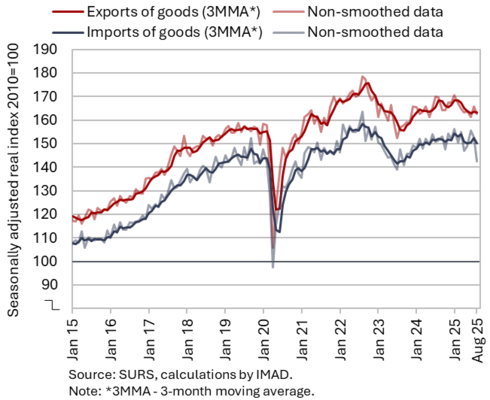
Goods exports and imports declined month-on-month in August and were lower than a year earlier; SURS made a significant downward revision to goods imports for the first seven months of the year, which also affects the balance of goods transactions. After growing in July, real exports fell by 2.0% month-on-month in August. Exports to both EU countries (particularly Italy) and non-EU countries decreased. Exports of metals and metal products, machinery and equipment, and various manufactured goods declined, while exports of pharmaceutical and other chemical products as well as vehicles increased further. Imports fell for the second consecutive month (by -6.6%), with declines seen in imports from both EU and non-EU countries. Imports of consumer goods fell sharply (all seasonally adjusted).
Exports and imports were lower year-on-year in August. In the first eight months of 2025, exports were on average down by 0.7% year-on-year, while imports remained broadly unchanged.
Export orders in manufacturing showed no significant change in September and remained at a very low level, indicating no signs of a faster recovery in exports in the coming months.
Slovenia’s export market share of goods in the EU market, Q2 2025
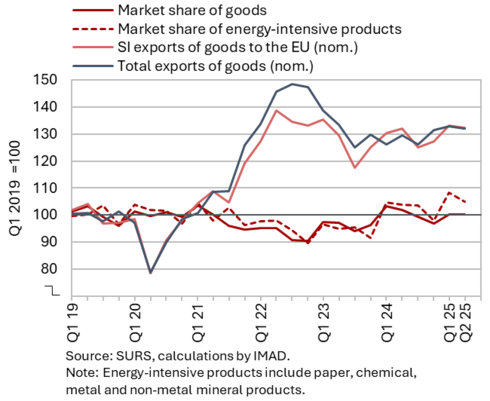
After declining in the second half of 2024, Slovenia’s goods export market share in the EU has stabilised quarter-on-quarter this year; however, in the first half of the year, it remained slightly lower year-on-year (by 2.3%). In the first two quarters, it stood at around 0.49% overall and 0.56% in manufacturing activities. Following the growth observed in 2024, the market share of road vehicles recorded the sharpest year-on-year decline in the first and second quarters (by an average of almost 10%). This was partly due to production restructuring at Slovenia’s largest vehicle manufacturer, which resulted in a marked decrease in vehicle exports to France and Italy. Year-on-year declines were also recorded in the market shares of various finished products, chemical products (excluding pharmaceuticals), metal products, and, to a lesser extent, other important export product categories (electrical equipment and other machinery and equipment). The year-on-year growth in the market share of pharmaceutical products and several energy-intensive products (non-metallic mineral products, metals) continued. Among Slovenia’s main trading partners, a notable year-on-year decline in the market share was recorded in France (mainly due to lower exports of road vehicles), with declines also observed in Croatia, Germany, and Italy, while the share increased in Austria.
Trade in services – in real terms, August 2025
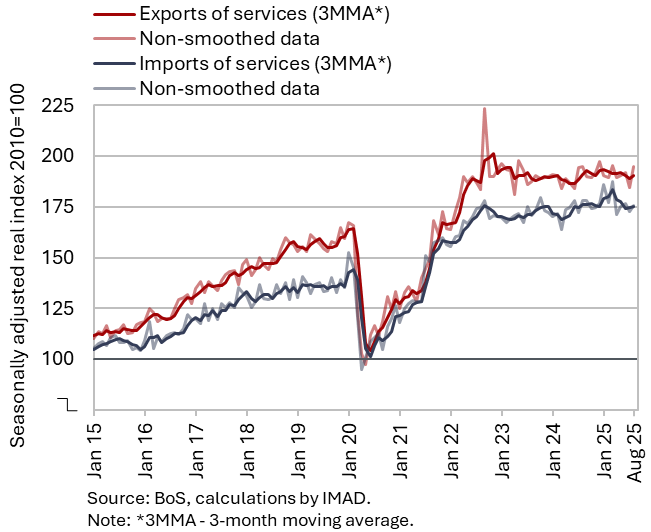
In August, both real exports and imports of services increased on a monthly basis and were higher year-on-year in the first eight months of 2025. Service exports fluctuated markedly over the past two months (–3.6% in July and +5.1% in August). The July decline was driven by most main service groups, while the August increase was mainly attributable to higher exports of other business services, transport services, and ICT services. Exports of tourism-related services decreased for the second consecutive month. Imports of most main service groups rose compared with previous months, while only imports of other business services declined – this category typically exhibits more pronounced monthly fluctuations (all seasonally adjusted).
Despite the year-on-year decline in August, both exports and imports of services in the first eight months were higher than in the same period last year (by 0.5% and 2.6%, respectively). The increase was mainly driven by higher trade in other business services and ICT services, and to a lesser extent by growth in tourism-related service exports. Year-on-year growth of trade in services has slowed gradually in the past two months.
During this period, Slovenia exported the largest shares of services to Germany (12.6%), Austria (11.6%), and Italy (8.1%).
Production volume in manufacturing, August 2025
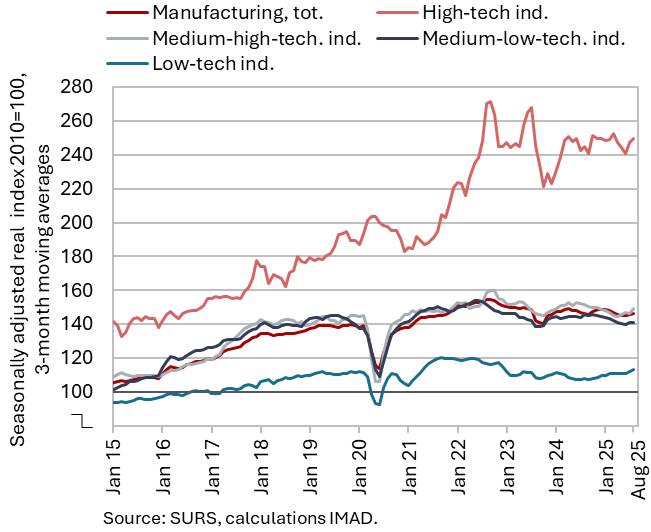
Manufacturing output has been strengthening across all groups of industries by technological intensity (seasonally adjusted) since mid-year; however, in the first eight months, it was 1% lower year-on-year. Since June, production has increased across all groups of industries by technological intensity, with the weakest growth observed in medium-low-technology industries (seasonally adjusted). Over the first eight months, production in medium-low- and medium-high-technology industries was on average lower than a year earlier, with the largest declines recorded in the metal industry (by 7.7%) and in the manufacture of motor vehicles, (semi-)trailers and other transport equipment (by 17.8%). Production also decreased across all energy-intensive industries. According to our assessment, the overall decline in manufacturing output is being mitigated mainly by the pharmaceutical industry, which, together with some less technology-intensive industries, recorded output growth in the first eight months.
According to business tendency data, the indicator of total orders in manufacturing remained at a low level in September, comparable to that recorded a year earlier. The indicator of expected production improved slightly and also slightly exceeded last year’s levels; however, it remained (like the total orders indicator) below the long-term average.
Activity in construction, August 2025
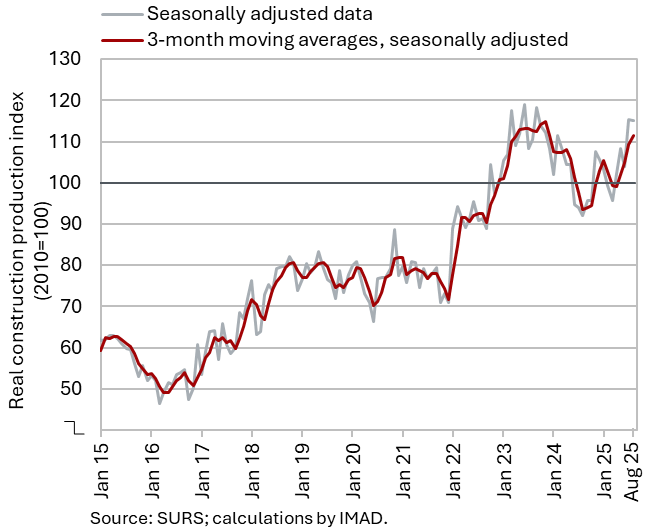
The value of construction put in place was considerably higher year-on-year in July and August. Following a decline in the first quarter, construction activity strengthened thereafter. According to SURS data on the value of construction put in place, activity in August was 25% higher than a year earlier and 4% higher in the first eight months as a whole. However, other data sources do not indicate such a strong increase in activity during the summer months. Based on VAT data, the activity of construction companies in August was 8% higher year-on-year. The discrepancy between the growth rates derived from VAT data and those from data on construction put in place amounted to as much as 17 p.p.
The confidence indicator in construction improved in September, reaching its highest level in the past year and a half. Companies generally assess new orders as “normal”. The main constraint continues to be a shortage of skilled labour. Only about one tenth of companies cite insufficient demand as a limiting factor, indicating that the construction sector is currently not facing demand-side problems; the constraints are primarily on the supply side.
Turnover in trade, July 2025
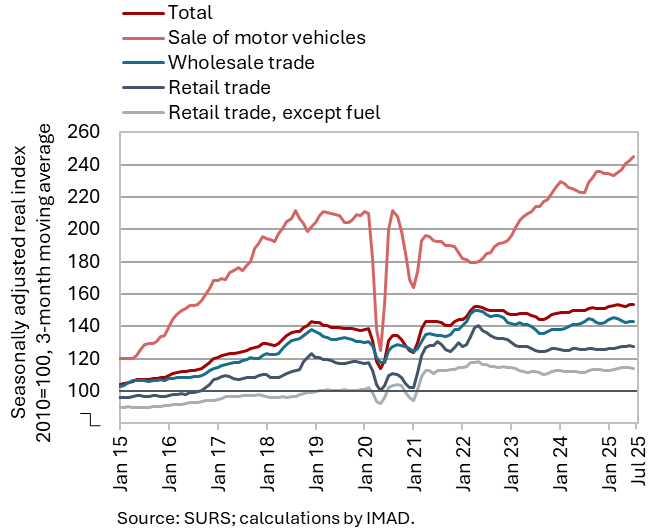
Despite weaker performance in most sectors in July, turnover in trade remained higher year-on-year across all sectors in the first seven months of the year. Wholesale turnover declined further in July after contracting in the second quarter and, for the first time this year, was lower year-on-year. Turnover also decreased year-on-year in retail trade with food products, which fell slightly in July following weak growth in the second quarter. Turnover from retail trade with non-food products stagnated after recording growth in the first two quarters, while turnover from the sale of motor vehicles increased sharply. Sales across all trade sectors were higher year-on-year in the first seven months. Growth was strong in the sales of motor vehicles (7%) and modest in other trade sectors (on average slightly above 1%).
Turnover in market services, July 2025
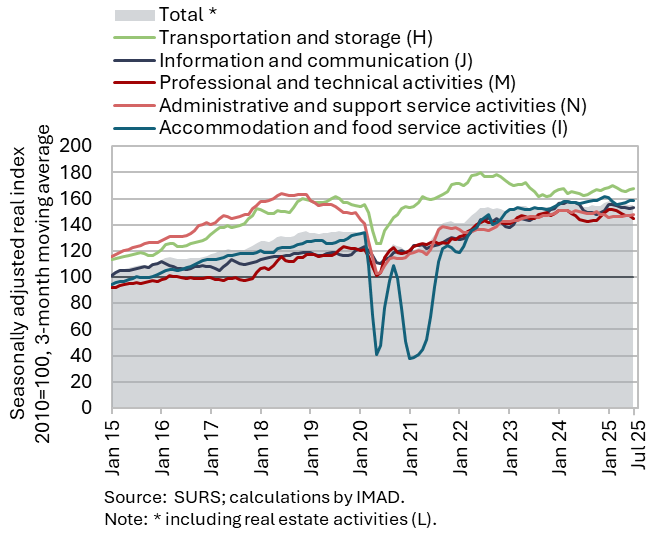
Total real turnover in market services declined further in July (by 1%, seasonally adjusted) after contracting in the second quarter and remained unchanged year-on-year. The sharpest decline was recorded in professional and technical activities (following a marked downturn in the second quarter), mainly due to a stronger contraction in architectural and engineering services and consultancy services. Turnover also decreased in accommodation and food service activities, after having increased in the second quarter. In transportation and storage, turnover declined slightly in July after falling in the previous quarter, with the largest drop in storage activities. Administrative and support service activities also recorded a decline (after growth in the second quarter). The only increase was recorded in information and communication (continuing the growth seen in the first half of the year), with stronger growth stemming from higher sales of services both in the domestic market (computer services) and abroad (telecommunications). In the first seven months of 2025, real turnover was higher year-on-year only in transportation and storage and in professional and technical activities.
Selected indicators of household consumption, Q3 2025
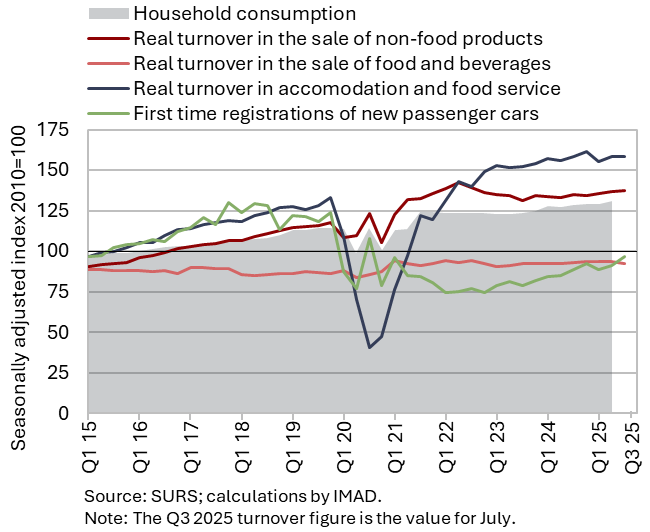
Data on household consumption in the beginning of the third quarter present a mixed picture; the nominal value of fiscally verified invoices was higher year-on-year in the third quarter. In July, households spent significantly more than a year earlier (+13.2%) on purchases of new passenger cars, following a year-on-year decline in the first quarter and a 4% increase in the second quarter. Turnover in retail trade with non-food products was also higher year-on-year (by 2.6%, a rate similar to that in the second quarter). In July and August, year-on-year spending on tourist services abroad was also higher (by 1%), while spending on food and beverages was lower (–0.7%, following a year-on-year growth in the second quarter); the number of overnight stays by domestic tourists in Slovenia also declined (by 4.9%).
The nominal value of fiscally verified invoices (a proxy for sales) was 3% higher year-on-year in the third quarter (following year-on-year stagnation in the first quarter and 5% growth in the second quarter).
Real estate, Q2 2025
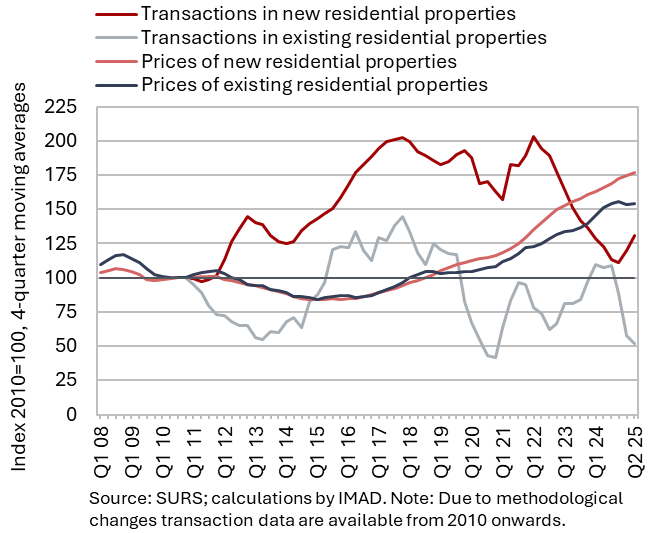
Year-on-year growth in dwelling prices accelerated in the second quarter, supported by a higher volume of transactions, but remained below the rates observed in previous years. Compared with the first quarter, prices rose by 3.8%, and relative to the same quarter last year by 5.5% (year-on-year increase in the first quarter was 3.2%, while the average year-on-year growth in 2023 and 2024 was slightly above 7%). Prices of existing dwellings increased by 6.4% year-on-year. Following a significant decline during 2022–2024, the number of transactions in this segment rose by 40% compared with the same period last year. Prices of newly built dwellings were also higher year-on-year (up 1%). However, transactions in this segment, which account for a small part of total sales (4%), declined sharply year-on-year (by more than one-third).
Road and rail freight transport, Q2 2025
The volume of road and rail freight transport further decreased in the second quarter of 2025. Overall, the volume of road transport decreased by 2% on a quarterly basis and by almost 13% year-on-year. In road transport performed by Slovenian vehicles, the volume of cross-trade increased slightly after a sharp decline in the first quarter, while the volume of transport at least partly taking place on Slovenian territory (exports, imports and national transport) decreased. The share of cross-trade in total transport amounted to 40%, which was 10 p.p. lower than before the COVID-19 pandemic. Rail freight transport in Slovenia declined by 1% in the second quarter and by 8% year-on-year. The volume of road and rail freight transport this year was the lowest since 2016.
Economic sentiment, September 2025
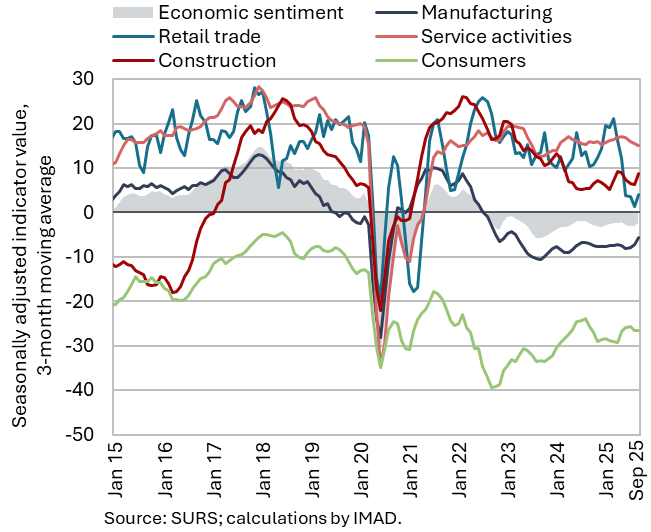
Economic sentiment improved further in September, both on a month-to-month and year-on-year basis, although it remained slightly below the long-term average. The increase in the value of the economic sentiment indicator, which rose for the third consecutive month, was driven by improved confidence in nearly all activities (except services) and among consumers. On a year-on-year basis, sentiment in services activities was weaker, while it was significantly better in construction, and also in manufacturing and among consumers. Compared with the long-term average, sentiment remained lower in manufacturing, retail trade, and among consumers, but was higher in construction and services.
Households facing financial distress, September 2025
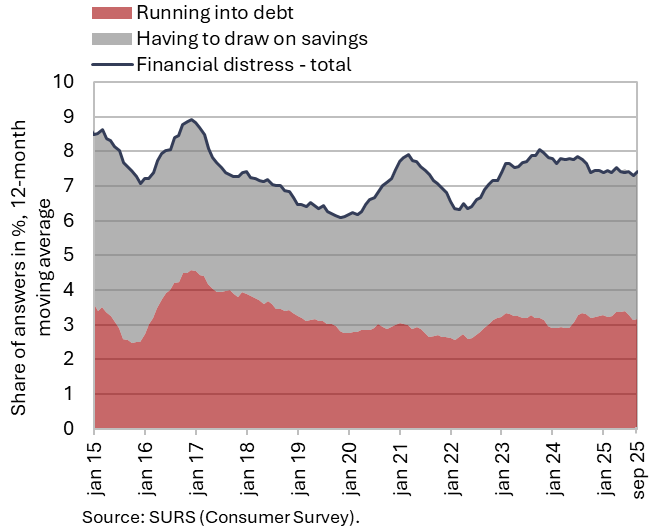
The financial situation of households in the second income quartile deteriorated slightly in the third quarter on a quarterly basis, while on average, the financial situation of households remained unchanged compared with the same period last year. Compared to the previous quarter, only the share of households facing financial distress in the second income quartile increased (by 2.3 p.p. to 9.7%), while on a year-on-year basis, their financial situation remained largely unchanged. The financial situation of households in the lowest income quartile improved, as the share of those facing financial distress decreased quarter-on-quarter (from 14.6% to 13.5%), while remaining unchanged year-on-year. The share of households facing financial distress and having to draw on savings to meet their needs increased slightly year-on-year, while the share of those running into debt declined slightly.
Number of persons in employment, July 2025
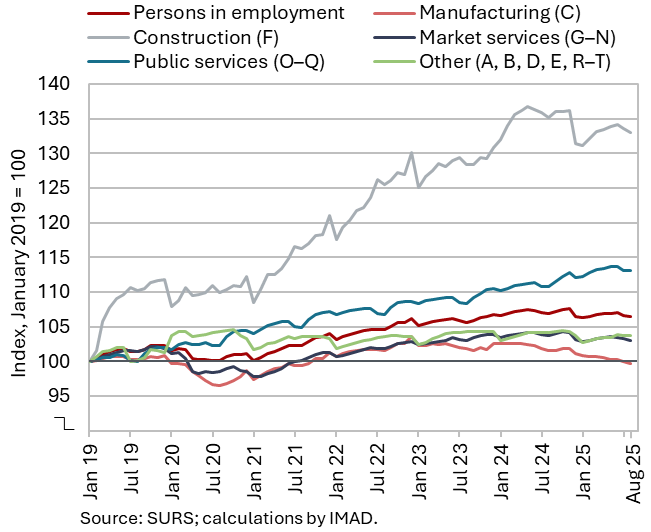
In August, the number of persons in employment remained broadly unchanged compared with previous months (seasonally adjusted) and was 0.4% lower year-on-year. The number of employees declined year-on-year in August (–0.6%), while the number of self-employed increased (1.5%). The steepest year-on-year decreases in employment were recorded in administrative and support service activities (–4%), mainly due to a decline in employment agencies, followed by manufacturing (–1.8%), and construction (–1.6%). Conversely, employment continued to rise in public service activities, most notably in human health and social work activities (3.5%) and in education (+1.5%).
The number of foreign citizens in employment increased by 1.9% year-on-year, while the number of Slovenian nationals in employment declined by 0.7%.
Number of registered unemployed persons, September 2025
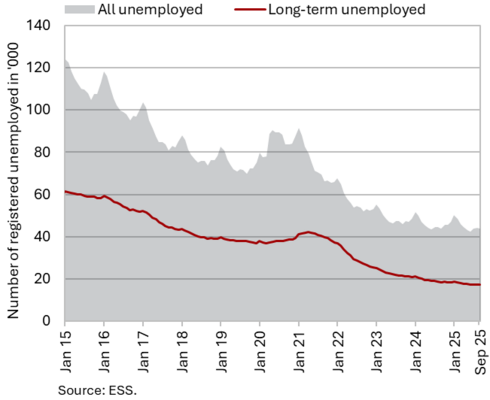
The number of registered unemployed persons increased for the third consecutive month in September (by 0.5%, seasonally adjusted). According to the Employment Service of Slovenia, this reflects an increased inflow of first-time jobseekers into unemployment, which since July this year is driven by a larger inflow of foreign nationals with temporary protection status into the unemployment register following legislative changes. According to original data, 43,944 people were unemployed at the end of September, 0.8% fewer than at the end of August. However, the number was 0.2% higher year-on-year. The year-on-year declines in long-term unemployment (–6.3%) and in unemployment among persons aged 50 and over (–7.3%) were somewhat smaller than in previous months. Since the end of last year, the number of unemployed young people (aged 15–29) has been above the level recorded a year earlier (in September, it was up 8% year-on-year).
Average real gross wage per employee, July 2025
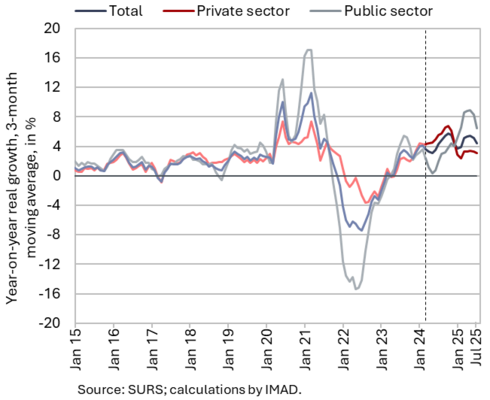
Year-on-year nominal growth in the average gross wage was lower in July (5.8%) than in the preceding months. This was due to slower, though still high, growth in the public sector (6.1%), while growth in the private sector remained largely unchanged (5.4%). In the public sector, year-on-year growth moderated over the past two months following strong increases earlier in the year due to the implementation of the wage reform. According to our assessment, this moderation was driven not only by the higher base from last year (reflecting the increase in pay-grade values to partially offset inflation in June last year) but also by the easing of current growth in some types of payments. In the private sector, growth continues to be supported, in our assessment, by excess demand for labour in certain parts of the economy. In the first seven months, the overall average gross wage increased by 4.8% in real terms – by 7.7% in the public sector and by 3.2% in the private sector.
Number of FSA beneficiaries and UB recipients, August 2025
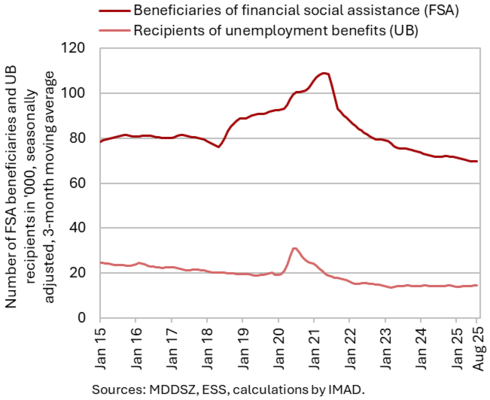
The number of unemployment benefit (UB) recipients and the number of financial social assistance (FSA) beneficiaries declined year-on-year in August. There were 13,928 UB recipients, 0.4% fewer than in August last year. Their share among all unemployed persons remained unchanged in August compared with a year earlier (31.4%), which is higher than the long-term average. With the continued decline in the number of long-term unemployed persons, who are often eligible for FSA, the number of FSA beneficiaries continued to fall year-on-year. In August, 68,508 persons were eligible for FSA, 3.5% fewer year-on-year, representing a larger decline than in recent months.
Consumer prices, September 2025
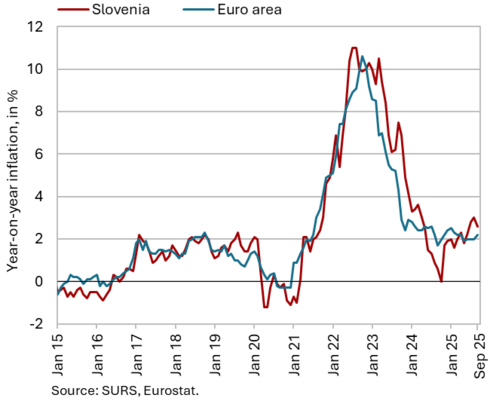
Year-on-year growth in consumer prices eased slightly in September, to 2.6%. Following a modest decline in clothing and footwear prices in August, prices in this group rose again in September (by 8.5%), though their year-on-year growth rate more than halved (to 3%). This contributed to a lower year-on-year increase in semi-durable goods prices (2% compared with 5.2% in August). Price growth in durable goods remained moderate (0.4%). Year-on-year growth in food and non-alcoholic beverage prices also slowed somewhat in September, yet remained the highest among all goods and services groups, at 7%, contributing 1.3 p.p. to the overall 2.6% year-on-year inflation rate. Year-on-year growth in service prices stood at 2.8% and has fluctuated around 3% since the beginning of the year. Year-on-year inflation, measured by the HICP, stood at 2.7% in September, 0.5 p.p. higher than in the euro area. Preliminary data indicate that much of this difference continues to stem from significantly higher growth in food, alcohol, and tobacco prices (Slovenia 6.2%, euro area 3%).
Slovenian industrial producer prices, August 2025
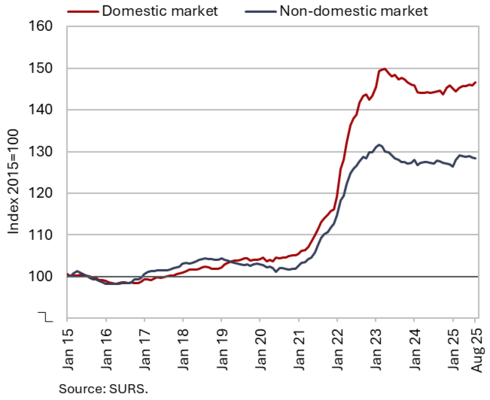
Slovenian industrial producer prices increased slightly month-on-month in August (0.2%), while year-on-year growth eased further due to a higher base (to 0.9%). Differences in price growth between the domestic market (1.5%) and foreign markets (0.4%) widened this time, as a result of a stronger monthly increase in prices on the domestic market (0.5%). Producer prices on foreign markets were marginally lower month-on-month. Consumer goods continued to record the strongest year-on-year growth, which edged up to 3.6%. This reflected a 0.8 p.p. acceleration in the growth of durable goods prices (to 1.2%), while the growth of non-durable goods prices remained unchanged (4.2%). Within non-durable goods, price growth in the manufacture of food products strengthened again (4.9%). Price growth in the intermediate goods group remained moderate (0.4%) and slowed for the second consecutive month. Prices of energy (-4.9%) and capital goods (-0.4%) remained lower year-on-year amid subdued economic activity.
Loans to domestic non-banking sectors, August 2025
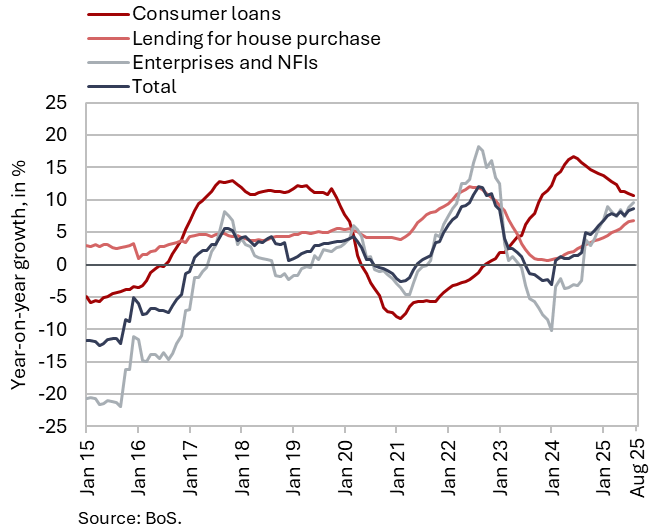
Year-on-year growth in the volume of loans to domestic non-banking sectors increased to 8.7% in August. The main contribution came from household loans (3.7 p.p.), which were 7.1% higher year-on-year. The growth of housing loans continued to accelerate gradually (6.8%), while consumer loan growth remained high (10.6%) despite signs of moderation. According to our assessment, this moderation primarily reflects a higher base, as new consumer lending increased by 15%. Loans to NFIs continued to grow at the fastest pace, increasing by two-thirds year-on-year in August. Although the growth of corporate loans strengthened somewhat over the past two months, it remained relatively moderate at 2.6%. The volume of deposits of domestic non-banking sectors was 6.2% higher year-on-year in August, the strongest increase since early 2023. The share of non-performing exposures (NPEs), which had remained around 1% for more than two years, rose to 1.1% in July, mainly due to a slightly higher share of non-performing loans to non-financial corporations (2.1%).
Government bonds, Q3 2025
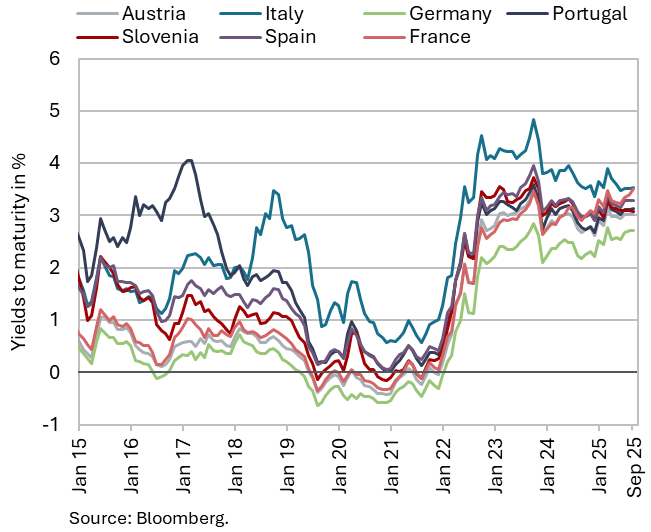
The yield to maturity on Slovenian government bonds declined by 4 basis points in the third quarter, to 3.09%. The spread to the German bond narrowed by 19 basis points (to 39 basis points), the lowest level in the past four years. This was mainly due to a 15 p.p. increase in the yield on the German government bond. Yields to maturity on bonds issued by some major euro area countries (e.g. Germany and France) rose amid uncertain economic conditions and expectations of higher public spending on infrastructure and defence. The ECB, however, did not change its interest rates in the third quarter, given the relatively stable inflation environment.
Current account of the balance of payments, July 2025
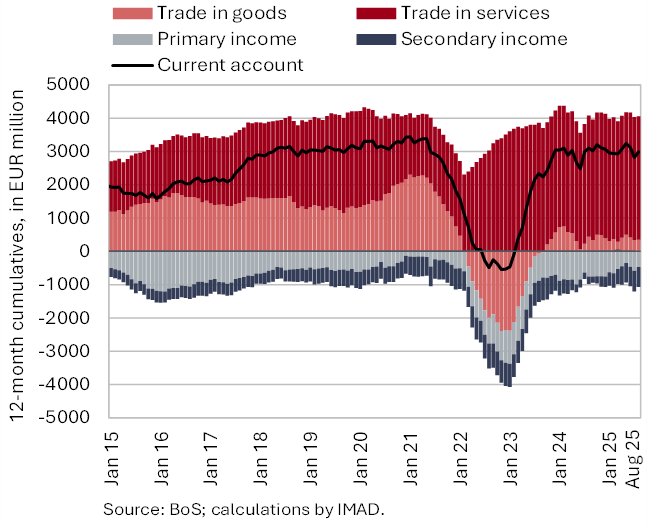
The 12-month current account surplus (until August) decreased by EUR 110,9 million compared to the previous 12-month period, amounting to EUR 3 billion (4.3% of estimated GDP). The decline was mainly driven by a wider deficit in secondary income, primarily due to lower receipts from the EU budget. The annual goods surplus was somewhat lower, and the gap was significantly smaller than in previous months’ releases, following a substantial revision of goods import values for the first seven months. The services surplus increased, particularly in the trade in other business services and transport services. The deficit in primary income narrowed, mostly due to lower net outflows of income from equity capital (dividends and profits). Net inflows of compensation of employees also increased, as the earnings of Slovenians working abroad rose more than the earnings of foreign workers employed in Slovenia.
Revenue (top figure) and expenditure (bottom figure) of the consolidated general government budgetary accounts, August 2025
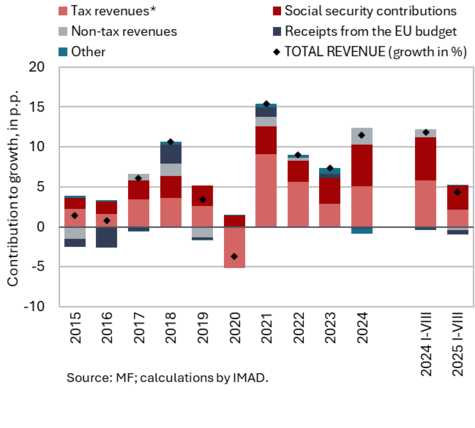
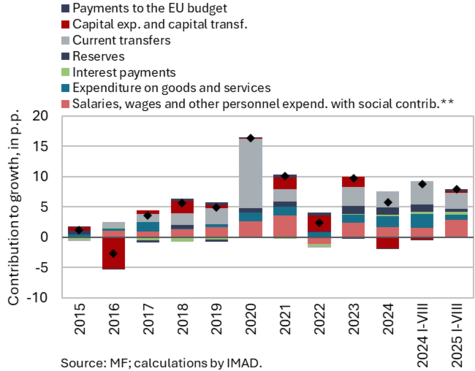
The consolidated general government deficit in the first 8 months of 2025 was EUR 688.1 million higher than in the same period of 2024. It amounted to EUR 1,066.2 million. The increase in the deficit reflects a slowdown in revenue growth, while expenditure continued to grow at a similar pace as last year. Revenues in the first eight months rose by 4.3%, compared to a 11.9% increase in the same period last year. The slowdown is related to cyclical factors and to measures that boosted the growth of social contributions and certain tax revenues last year. Expenditure in the first eight months rose by 8.0% year-on-year, compared to an 8.8% increase in the same period last year. This year, expenditure growth has been driven more than last year by higher compensation of employees due to the implementation of the public sector pay reform, investment spending, and payments to the EU budget. The bulk of the consolidated general government deficit stems from the central government budget deficit. In the first eight months of this year, the latter amounted to EUR 1,068 million, while according to preliminary data, it was somewhat lower in the first nine months (EUR 953 million). By the end of the year, the deficit is expected to increase, as planned. Revenue growth is nevertheless expected to strengthen by year-end, supported by receipts under the Recovery and Resilience Plan and by non-tax revenues (from profits of state-owned enterprises), which declined year-on-year in the first eight months. At the same time, investment expenditure is also expected to accelerate.