Slovenian Economic Mirror
Slovenian Economic Mirror 5/2025
In Slovenia, the values of short-term indicators for April and May point to weak growth in trade sectors, construction and manufacturing. Household consumption strengthened, while exports and imports continued to decline. In the first four months of the year, economic activity was higher year-on-year only in trade, transport and storage, and certain high-technology manufacturing sectors. After an improvement in May, economic sentiment deteriorated in June and was lower than a year earlier. Following a decline in May, inflation edged up slightly in June to 2.2%, mainly due to higher prices of food and non-alcoholic beverages, which remain the main contributors to inflation. The number of persons in employment, after falling at the end of last year, remained broadly stable until April this year, while the number of unemployed continued to decline slightly in June. This issue’s selected topic focuses on life satisfaction, which, according to the latest measurement conducted in spring of this year, remained at its highest levels in Slovenia, similarly to the EU.
Euro area composite Purchasing Managers’ Index (PMI), June 2025
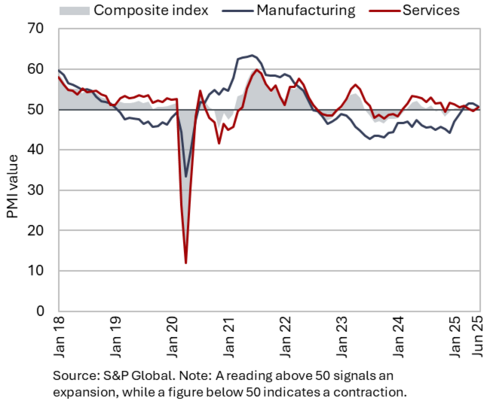
Indicators of economic activity for the euro area in the second quarter point to weak growth. The composite PMI edged up slightly in June (to 50.6), while the second-quarter average remained largely unchanged from the first quarter (50.4), continuing to indicate weak growth in economic activity. The services PMI signalled a recovery in activity in June following a deterioration in May, while the manufacturing PMI declined slightly but remained above 50 (the threshold between expansion and contraction). The Economic Sentiment Indicator (ESI) deteriorated in June amid a decline of confidence in industry and remained lower year-on-year. On average in the second quarter, it was lower than in the first. The Ifo and ZEW indicators, which measure sentiment in the German economy, improved further in June – ZEW saw its strongest increase since April 2023. Manufacturing output in the euro area contracted by 2.2% in April compared with March (seasonally adjusted), while the value of construction work put in place increased by 1.7%. Retail trade turnover declined in May following an increase in April. On average over the first four or five months, all three indicators were higher year-on-year.
WIIW Summer Forecast, June 2025
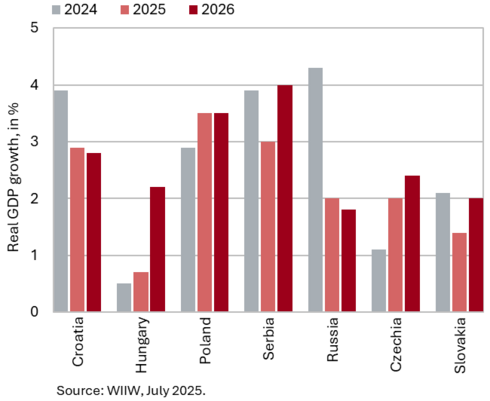
Economic growth in most Central, Eastern, and Southeastern European countries is expected to remain relatively high in 2025 and 2026. For 2025, the Austrian institute WIIW forecasts an average growth rate of 2.3% for the EU Member States in the region, rising to 2.8% in 2026. Although many countries in the region struggle with the difficulties in German industry, growth is being driven by strong private consumption, supported by high employment and rising wages. Poland, Bulgaria, and Croatia are projected to record the highest growth rates this year and next. High growth is also expected to persist in the Western Balkans this year and next. In Serbia, the region’s most important trading partner, growth is projected at 3% this year, increasing to 4% in 2026. In Russia, where growth over the past two years has been driven by the defence industry, it is expected to halve this year to 2% due to tighter monetary policy. The greatest downside risk to economic growth in the region is a potential escalation of the conflict between Israel and Iran. A closure of the Strait of Hormuz could trigger a sharp rise in oil prices, leading to higher inflation. An additional risk is a possible trade war between the United States and the EU, which – despite relatively small direct trade flows with the US – could affect the region through reduced demand for industrial products and lower foreign investment.
Commodity prices, June 2025
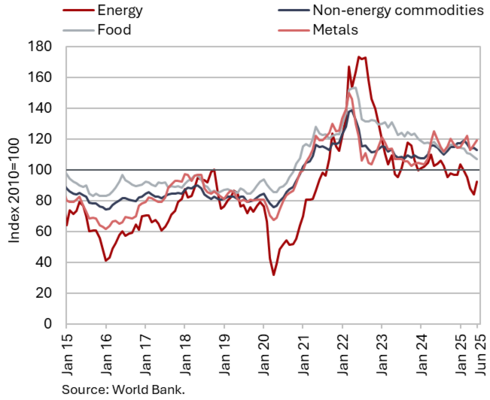
Brent crude oil prices increased on average in June compared with May, while non-energy commodity prices declined slightly. The average dollar price of Brent crude oil increased by 11.1% to USD 71.44 and the euro price by 8.8% to EUR 62.04 due to the appreciation of the euro. Year-on-year, the oil price was 13.1% lower in US dollars and 18.9% lower in euros. Following Israel’s attack on Iran in mid-June, the price of Brent oil surged to USD 80/barrel, but fell below USD 70/barrel after a ceasefire was announced on 24 June. The average euro price of natural gas on the European market (Dutch TTF) edged up by 4.1% to EUR 36.6/MWh in June, and was 6.3% higher year-on-year. Gas prices rose due to unplanned outages at Norwegian liquefied natural gas plants and the European Commission’s announcement to gradually stop the import of Russian gas imports by 2027. According to the World Bank, the average dollar price of non-energy commodities fell by 1.1% in June both on a monthly and a yearly basis. On a monthly basis, the largest declines were recorded in beverage commodities (tea, cocoa), while year-on-year, food prices fell the most.
Effective exchange rate, Q1 (REER ulc) and Q2 2025 (REER hicp, ppi)
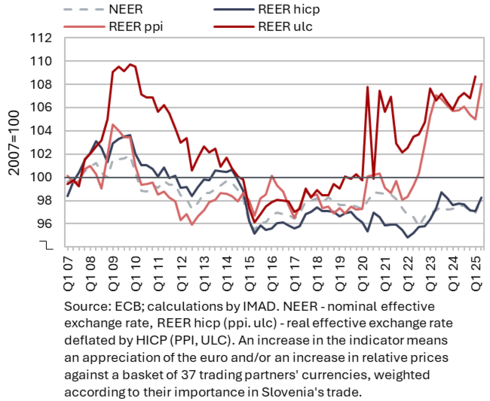
In the second quarter of 2025, indicators of price competitiveness deteriorated significantly, following a marked decline in cost competitiveness already observed in the first quarter. Both indicators of price competitiveness (REER hicp, ppi), which had been gradually improving since the energy shock (i.e. after 2022), experienced a considerable deterioration in the second quarter of this year. This deterioration stemmed from an increase in the nominal effective exchange rate (NEER), i.e. the appreciation of the euro, and from higher growth in industrial producer prices in Slovenia compared with its trading partners (i.e. an increase in relative PPI). Already in the first quarter (latest data), growth in unit labour costs (ULC) accelerated, leading to a more pronounced deterioration in the cost competitiveness indicator (REER ulc). Cost competitiveness had already been gradually deteriorating for most of 2024, mainly due to strong ULC growth in the construction sector (and gradually increasing ULC in market services). In the first quarter of this year, however, ULC also increased in manufacturing activities.
Short-term indicators of economic activity in Slovenia, April–May 2025
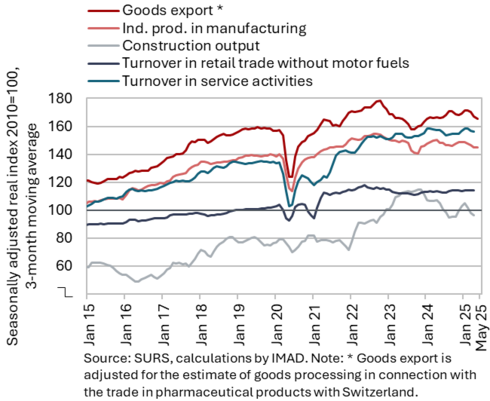
In Slovenia, the values of short-term indicators for April and May suggest weak growth in trade sectors, construction and manufacturing, while exports and imports continued to decline. In the first four months, economic activity was higher year-on-year only in trade, transportation and storage, and certain high-technology manufacturing industries. Real goods exports and imports declined on a monthly basis in May: exports decreased for the fourth consecutive month (–0.8%, seasonally adjusted), most notably to EU countries (–1.0%), especially to Austria, Italy and Croatia. Exports of machinery and equipment have been falling for several months (excluding road vehicles, whose exports increased on a monthly basis in April and May); exports of primary products (excluding energy products), metals and metal products, and certain other materials were also lower than the average in the first quarter. Imports also declined slightly (–0.3%), primarily from non-EU countries. In the first five months on average, goods exports were at a similar level as a year earlier (–0.1%), while imports were higher (by 1.5%). Following contraction since the beginning of the year, manufacturing output increased in May, but over the five-month period it remained lower than a year earlier. In May, monthly growth was recorded in most industry groups by technological intensity, with a slight decline only in medium-high-technology industries (seasonally adjusted). Construction activity increased in April, driven by higher values across all types of construction works, but in the first four months of the year it was significantly lower than a year earlier. The largest shortfall was recorded in the construction of civil engineering works. The total real turnover of market services declined in April after stagnating in the first quarter. In the first four months on average, year-on-year growth was recorded only in transportation and storage. In retail trade with food, the sharp decline in turnover in March was followed by a notable increase in April. Real turnover was higher year-on-year in April and in the first four months overall in all trade sectors.
Electricity consumption by consumption group, June 2025
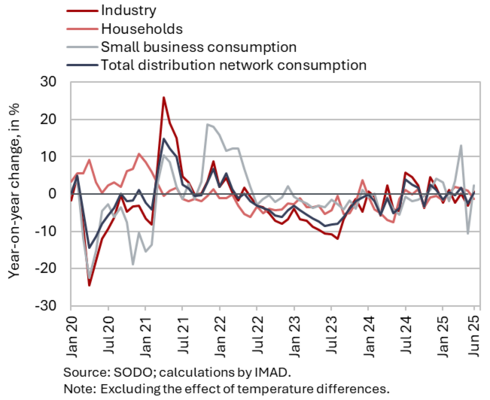
Electricity consumption in the distribution network was similar in June than in the same month last year. With one more working day this June, industrial consumption, which can serve as an indicator of economic activity, increased slightly year-on-year (0.7%). Household consumption was 1.4% lower year-on-year, while small business consumption – which accounts for only a small share of total consumption – was 2.2% higher.
Trade in goods – real, May 2025
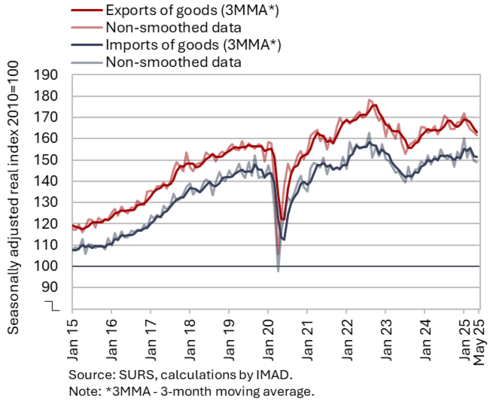
Goods exports and imports continued to decline on a monthly basis in May, and their volumes were lower than a year earlier. Uncertainty in the international environment and weak demand from key trading partners have had a significant impact on Slovenia’s trade in goods and on sentiment in export-oriented sectors in recent months. Real goods exports declined for the fourth consecutive month in May (–0.8%, seasonally adjusted), driven by lower exports to EU countries (–1.0%), particularly to Austria, Italy and Croatia. Exports of machinery and equipment (excluding road vehicles) have been decreasing for several months. Compared with the first quarter average, exports of primary products (excluding energy), metals and metal products, and some other materials were also lower. Imports also declined slightly (–0.3%), primarily from non-EU countries. As in the previous month, imports of intermediate goods decreased (all seasonally adjusted). In May, both exports and imports of goods were also lower year-on-year. On average over the first five months, exports remained broadly unchanged compared with the same period last year (–0.1%), while imports were higher (1.5%).
Export orders remained at a very low level in June and have shown no significant change for nearly two years.
Slovenia’s export market share in the EU market, Q1 2025
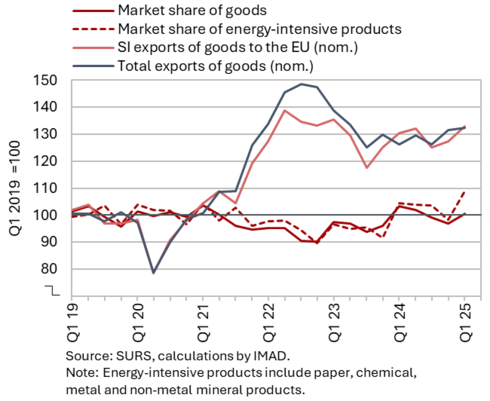
Slovenia’s export market share in the EU goods market increased slightly at the beginning of this year after several quarters of decline, but remained lower year-on-year. In the first quarter of this year, it stood at 0.49%, and at 0.56% in manufacturing. Following three quarters of decline, the development was marked by a gradual quarter-on-quarter increase in market share of certain energy-intensive products (metals, non-metallic mineral products, paper and pulp) and pharmaceuticals. Compared with the same period last year – when the total market share reached its highest level since the energy crisis – it was somewhat lower (–2.8%). The production and geographical decomposition of the year-on-year change in market share point primarily to a decline in export performance for specific products, while the export structure had no significant impact on market share growth. Compared with the same period last year, the largest decline was recorded in the market share of road vehicles, which, after several quarters of decline, was nearly 10% lower year-on-year and significantly below the peak reached five years ago (Q1 2019: 0.91%, Q1 2025: 0.68%). There was also a substantial year-on-year decline in the market share of metal products, which has been falling since the fourth quarter of 2023, and in rubber products. It is estimated that these trends are largely linked to the deteriorating conditions in the European automotive industry.
Trade in services – in real terms, April 2025
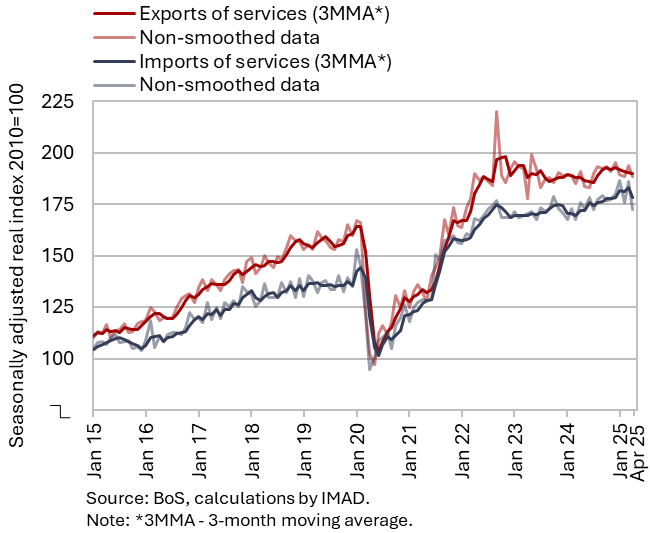
In April, real exports and imports of services declined both month-on-month and year-on-year; however, in the first four months of the year, both were higher than in the same period last year. On a monthly basis (seasonally adjusted), exports and imports decreased across most major service groups, with the exception of tourism-related services. Exports of these services rose in April to their highest level in the past year, accompanied by an increase in imports (seasonally adjusted). The largest contributions to the decline in total exports came from lower exports of other business services and ICT services, while the decline in imports was primarily driven by lower imports of other business services and transport services. Fluctuations in other business services have been high in recent months, particularly in trade with Switzerland.
In the first four months of the year, service exports were higher than in the same period last year, primarily due to year-on-year growth in exports of other business services during the first three months. Most other major service groups, however, remained lower year-on-year. Service imports over the four-month period were significantly higher than a year earlier (driven mainly by increased imports of other business services, ICT services, and transport services).
Production volume in manufacturing, May 2025
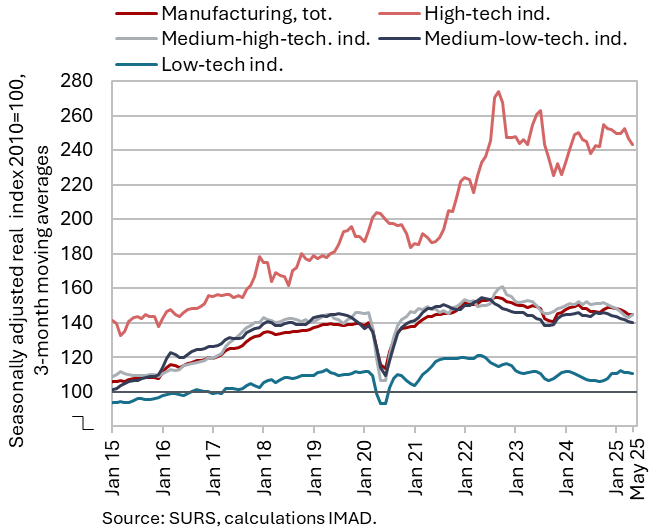
Manufacturing output, which had contracted earlier in the year, increased in May (by 0.7%, seasonally adjusted); in the first five months, it was 2.0% lower year-on-year (working-day adjusted). On a monthly basis, output strengthened across most industry groups by technological intensity, declining slightly only in medium-high-technology industries (seasonally adjusted). Over the first five months, output in this group was on average 4.5% lower than in the same period last year, primarily due to a decline in the manufacture of motor vehicles and other transport equipment. Output in the manufacture of machinery and equipment n.e.c. was also slightly lower year-on-year. Output in the energy-intensive chemical industry remained higher than a year earlier, and, following a decline in 2024, the manufacture of non-metallic mineral products was also higher year-on-year. In other energy-intensive industries, however, output declined slightly after having increased in 2024. Output also declined in certain low-technology industries (most notably leather manufacturing) and in medium-low-technology manufacture of fabricated metal products. Output in high-technology industries remained higher year-on-year, in our assessment primarily due to growth in the pharmaceutical industry.
The confidence indicator in manufacturing declined slightly further in June. Compared with the first quarter, particularly the overall order books indicator was lower, and it also declined year-on-year – as did the indicator of expected production.
Activity in construction, April 2025
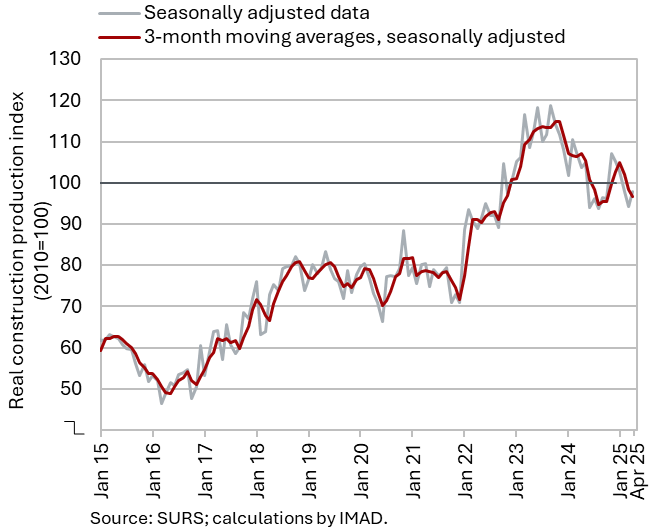
Following a decline in the first quarter, construction activity increased in April, though it remained lower year-on-year. Activity gradually declined over the course of last year, but rose sharply in the fourth quarter. In the first quarter of this year, it declined again; in April, however, it increased by 4% compared to March, as the value of all types of construction works increased. In the first four months of the year, the value of construction put in place was 8% lower than in the same period last year, with the largest decline recorded in civil engineering (-19%).
Activity in civil engineering is traditionally linked to government investment activity. Capital expenditure (according to the consolidated general government budgetary accounts) was 2% higher year-on-year in the first four months; within this, expenditure on new constructions, reconstructions, and renovations – which, in our assessment, is most closely related to construction activity – increased by 6%. The lower activity in civil engineering at the beginning of the year may thus be related to reduced investment by infrastructure companies and/or budgetary funds.
Turnover in trade, April 2025
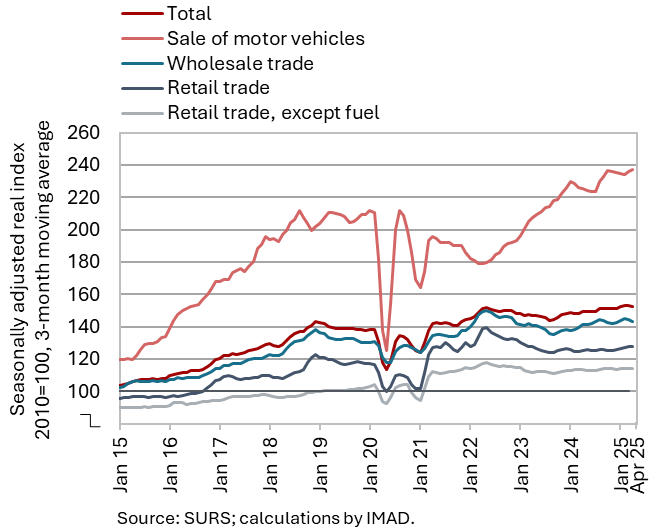
In April, real turnover increased both month-on-month and year-on-year across all trade sectors. Turnover in retail trade with food products, which had declined both quarter-on-quarter and year-on-year in the first quarter due to a sharp drop in March, strengthened significantly in April. The fluctuations were mainly the result of the timing of Easter holidays and related purchases (which occurred in March last year and in April this year). Following growth in the first quarter, turnover continued to increase in the sales and repair of motor vehicles, wholesale trade, and retail trade with non-food products. Sales in all trade sectors were also higher year-on-year in April and cumulatively in the first four months of the year.
Turnover in market services, April 2025
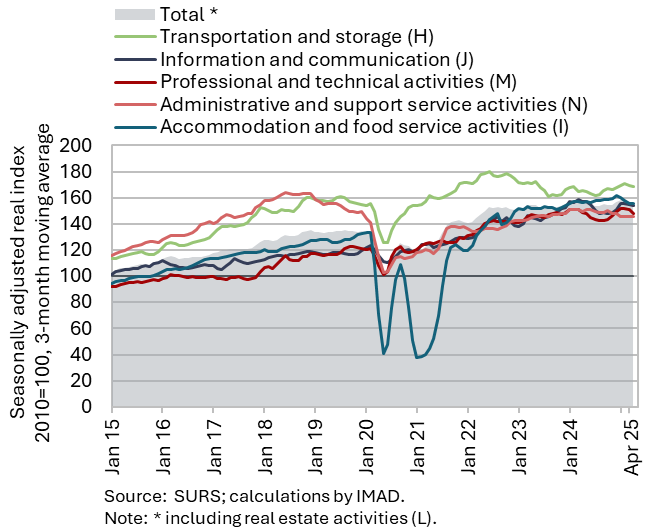
Total real turnover in market services declined in April (by 1.3%, seasonally adjusted) after stagnating in the first quarter; on average over the first four months, it was also slightly lower year-on-year (down by 0.5%). Following growth in the first quarter, the most pronounced decline in April was recorded in professional and technical activities, as turnover fell across all services within this group. A somewhat smaller decline was seen in administrative and support service activities, where negative trends have persisted for a longer period, particularly in employment services. Turnover in information and communication edged down slightly in April, following strong growth in the first quarter. Turnover in accommodation and food service activities increased in April, following a significant decline in the first quarter. It also rose in transportation and storage, where turnover has been gradually increasing since mid-2024; in April, growth resumed in both major segments (land transport and storage). In the first four months, real turnover was up year-on-year only in transportation and storage.
Selected indicators of household consumption, April 2025
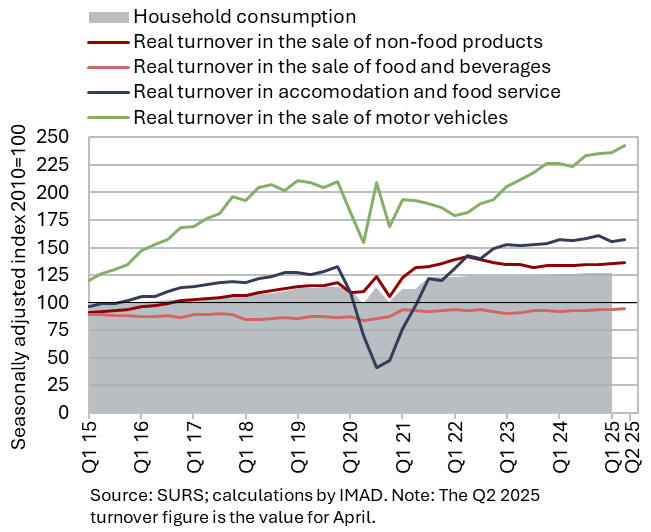
Based on available data, year-on-year growth in household consumption was higher at the beginning of the second quarter than in the first, when it was 0.4%. Following a year-on-year decline in the first quarter, spending on food and beverages was 8% higher year-on-year in April. The fluctuations primarily reflected the timing of the Easter holidays and associated spending (which took place in March last year, but in April this year). Turnover in trade with non-food products was higher year-on-year in April (by 2%, a rate similar to that in the first quarter). Households spent more year-on-year on tourism services abroad, and the number of overnight stays by domestic tourists in Slovenia increased as well (by 3%). The sale of new passenger cars to natural persons remained lower year-on-year (–2%).
Higher year-on-year household consumption growth in the second quarter is indicated by the nominal value of fiscally verified invoices (as a proxy for sales), which rose by 5% year-on-year in the second quarter, after stagnating in the first quarter.
Real estate, Q1 2025
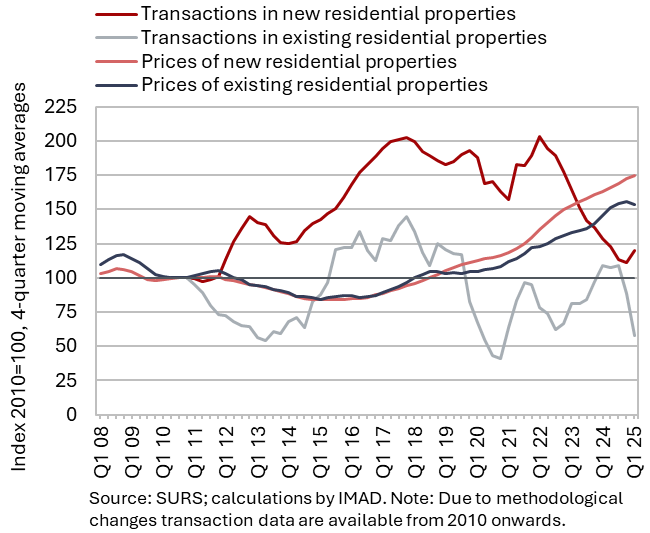
Amid a growth in the volume of sales, the year-on-year growth in dwelling prices moderated further in the first quarter of this year. After an average growth of 7.5% last year, prices were 3.2% higher compared to the first quarter of 2024, but 2.0% lower compared to the last quarter of 2024 – marking the first decline following several years of rising prices. Prices of existing dwellings were 4.8% higher year-on-year. The number of transactions in this segment, following a three-year decline, increased by nearly 30% year-on-year. In contrast, the prices of newly built dwellings declined year-on-year (by 4.8%) and were also lower than in the fourth quarter of 2024 (by 8.8%). The number of their transactions, which only account for a small part of total sales (3%), also fell sharply year-on-year (by three quarters), but their number was relatively high in 2024 according to the revised data.
Economic sentiment, June 2025
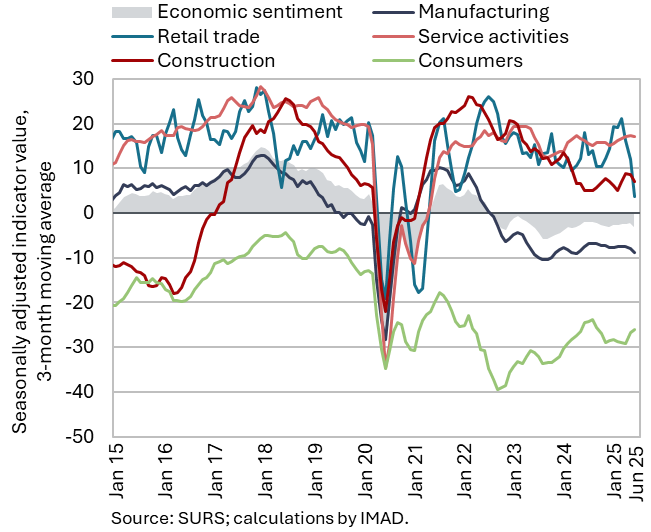
The economic sentiment indicator declined in June after improving in May and was lower than a year earlier. At the monthly level, the sharpest decline in the confidence indicator was recorded in retail trade, driven by lower assessments of sales and inventories. Confidence indicators also declined slightly compared with the previous month in manufacturing, services, construction, and among consumers. Compared to June last year, the confidence indicator was slightly higher in construction and in services, where it has been higher year-on-year for the third consecutive month. In contrast, confidence indicators in other activities and among consumers were lower year-on-year.
Households facing financial distress, June 2025
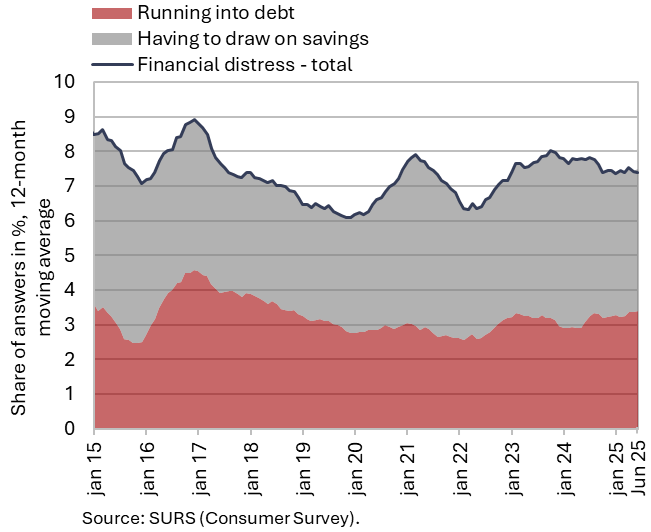
On average in the second quarter, the financial situation of households remained largely unchanged both quarter-on-quarter and year-on-year. Compared to the previous quarter and the same period last year, the share of households from the lowest-income quartile facing financial distress increased (by 2.3 p.p. quarter-on-quarter and by 2.7 p.p. year-on-year, to 14.6%). The financial situation of other households improved, most notably for households in the second income quartile (up by 1.6 p.p. quarter-on-quarter and 2.2 p.p. year-on-year, to 7.5%). The share of households facing financial distress and having to draw on savings to meet their needs remained broadly unchanged year-on-year. However, amid falling interest rates, the share of households running into debt increased slightly.
Number of persons in employment, April 2025
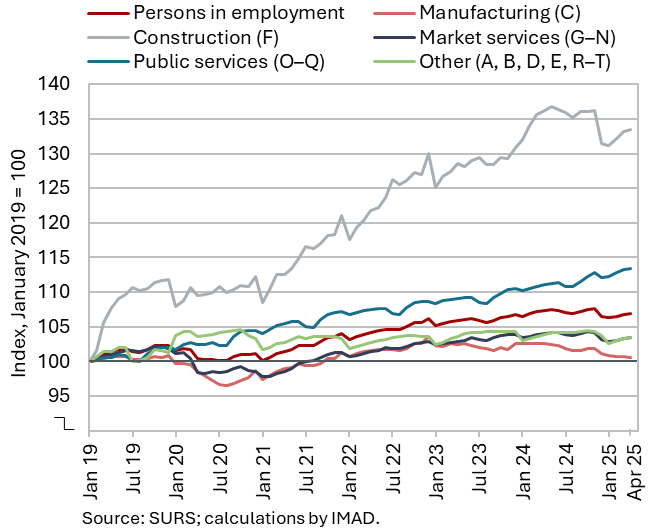
Following a decline at the end of last year, the number of persons in employment has remained broadly stable in recent months (seasonally adjusted). In April, the number of employed persons was 0.4% lower year-on-year. The sharpest decline occurred in administrative and support service activities (-4.8%), mainly due to a decline in employment agencies. The number of employed persons was also noticeably lower than a year ago in construction (–2.1%) and in manufacturing (–2.0%), where labour shortages persist. In contrast, year-on-year growth was observed in public service activities, particularly in human health activities (3.3%) and education (1.7%).
Number of registered unemployed persons, June 2025
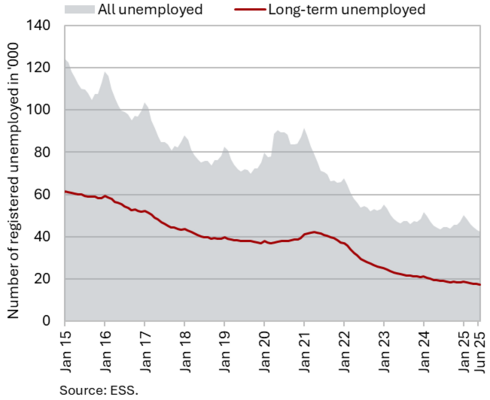
In June, the number of registered unemployed persons (seasonally adjusted) continued to decline slightly (by 0.4%). According to original data, 42,398 people were unemployed at the end of June, 1.8% fewer than at the end of May. Year-on-year, the number of unemployed was 2.2% lower, marking a similar decrease compared to previous months. The year-on-year decline in the number of long-term unemployed (–9.2%) was similar to that recorded in May, while the decrease in the number of unemployed persons aged over 55 (–11.2% in June) was slightly smaller than in previous months. In contrast, youth unemployment (ages 15–29) has been increasing year-on-year since the end of last year (5.7% higher in June compared to the same month of 2024).
Average nominal gross wage per employee, April 2025
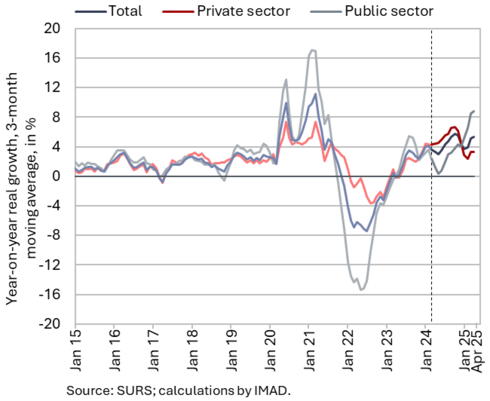
Year-on-year nominal growth in the average gross wage remained high in April (7.4%), particularly in the public sector (11.4%), but also in the private sector, where it moderated somewhat (5.4%). In the public sector, the strong growth is linked to the wage reform including the agreed increase in base wages at the beginning of the year (in the general government sector, which includes most of the public sector), as well as, in recent months, to somewhat stronger wage growth in public companies. In the private sector, growth is, in our assessment, still supported – among other factors – by excess demand for labour in certain parts of the economy, as indicated by a higher job vacancy rate in the first quarter (compared with the previous quarter) and a continued moderate decline in unemployment. In real terms, the average gross wage increased by 5.1% in April – by 3.0% in the private sector and by 8.9% in the public sector.
The number of FSA beneficiaries and UB recipients, April 2025
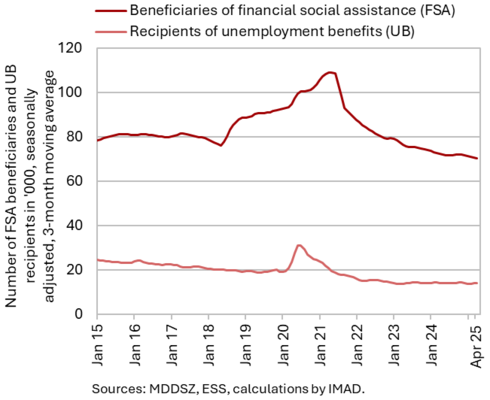
In April, the number of unemployment benefit (UB) recipients was slightly higher than a year earlier, while the number of financial social assistance (FSA) beneficiaries was lower. There were 13,211 UB recipients in April, representing a year-on-year increase of 2.6%, reflecting a somewhat higher inflow of persons eligible for UB into unemployment. DNB was received by 29.8% of all unemployed persons in April, compared with 28.5% in April of the previous year. Amid a fall in the number of long-term unemployed, who are often eligible for FSA, the number of FSA beneficiaries continued to fall year-on-year. In April, 72,029 people received FSA, which is about 2.7% less than in April 2024.
Consumer prices, June 2025
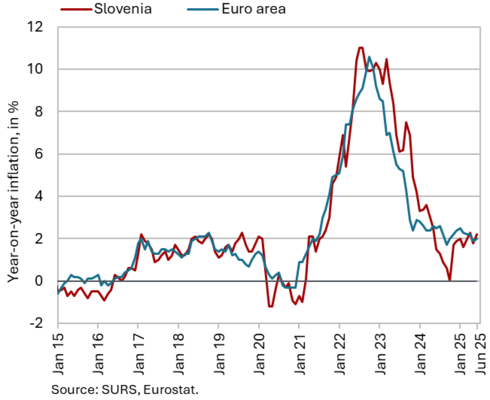
After slowing in May, the year-on-year growth in consumer prices strengthened slightly in June (by 0.4 p.p. to 2.2%), while prices were 0.8% higher on a monthly basis. In addition to seasonal factors (particularly higher prices of package holidays, up by 9.1%), the monthly increase was significantly driven by higher food prices (up by 1.2%), and to a lesser extent by higher excise duties on alcohol and tobacco, where prices rose by 1.8%. Year-on-year, the highest growth continues to be recorded in the food and non-alcoholic beverages group, where inflation strengthened to 6.7% in June (from 5.5% in May), contributing more than half of the annual inflation. Price growth in the restaurants and hotels group also remained high (5.0%). The year-on-year decline in prices in the transport group was significantly smaller than in the previous month (–0.3%, May: –1.9%). Year-on-year growth in prices of semi-durable goods also slowed in June (to 1.2%), while prices of durable goods were slightly higher for the first time since November 2023 (by 0.1%). The year-on-year growth in service prices also slowed, from 3.2% to 2.6%. Inflation as measured by the HICP rose to 2.5% in June, exceeding the euro area average by 0.5 p.p.
Slovenian industrial producer prices, May 2025
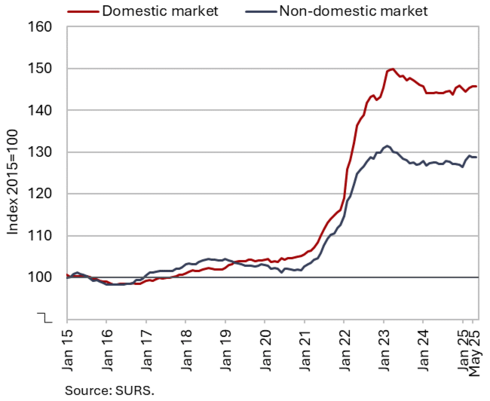
Slovenian industrial producer prices remained unchanged month-on-month in May, while year-on-year growth held steady at 1%, both on the domestic and foreign markets. Year-on-year, the highest increase was again recorded in consumer goods prices (2.7%), although slightly lower than in the previous month (3.0%). Within this group, the increase is driven by higher prices of non-durable goods (3.5%), while prices of durable goods remain lower year-on-year (–0.9%). Year-on-year growth in the prices of intermediate goods has stabilised around 0.5%, while the growth in prices of capital goods was minimal (0.1%). Energy prices, which declined for the second consecutive month on a monthly basis in May, remain lower also year-on-year. However, their decline (–2.0%) more than halved compared with the previous month due to a low base.
Loans to domestic non-banking sectors, May 2025
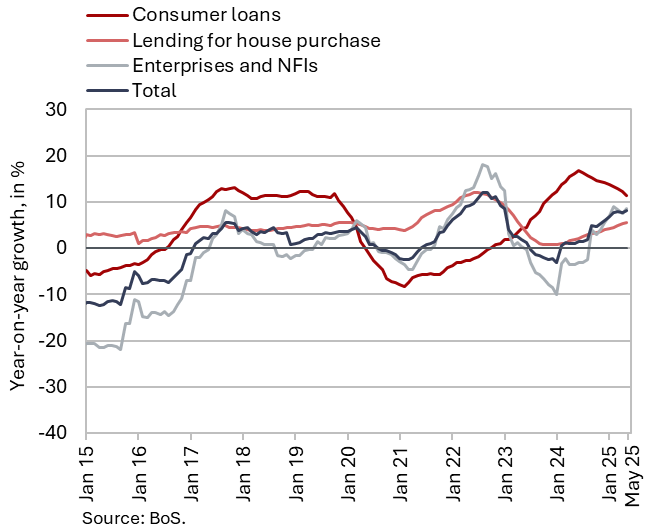
Year-on-year growth in the volume of loans to the domestic non-banking sectors strengthened slightly in May and, for the first time since January 2023, exceeded 8%. The main contributors to growth continued to be loans granted to non-monetary financial institutions (NFIs) and households (jointly accounting for 6.5 p.p.). Loans to NFIs grew at the fastest pace, rising by nearly 70% year-on-year. The growth rate of loans to households remained stable at 6.5%. The growth of housing loans is gradually accelerating, while the growth of consumer loans is moderating; however, at 11.3%, it remains relatively high. In our assessment, the moderation in growth is primarily due to the higher base, as new borrowing in the form of consumer loans remains relatively elevated. In the first five months of this year, it amounted to approximately EUR 785 million, more than 16.5% higher than in the same period last year. Year-on-year growth in non-banking sector deposits strengthened by 2 p.p. in May (to 5.7%), which, in our assessment, is partly due to the disbursement of annual holiday bonuses. In an environment of low deposit interest rates, only overnight deposits are increasing again; these account for more than 80% of all deposits of the non-banking sector. The share of non-performing claims stands at 1%.
Bond, Q2 2025
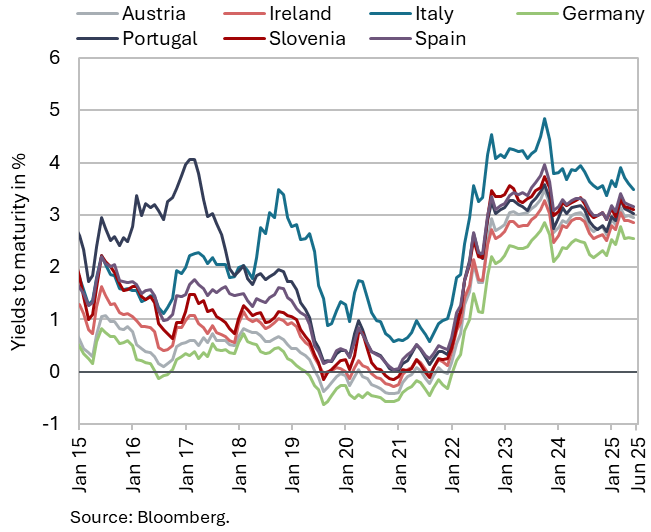
Yields to maturity on government bonds of euro area Member States did not change significantly in the second quarter of this year, despite the continued lowering of the ECB’s key interest rate (by 50 basis points). The yield to maturity of the Slovenian government bond remained unchanged from the previous quarter (3.13%), while the spread to the German bond increased by 3 b.p., to 58 b.p.
Current account of the balance of payments, April 2025
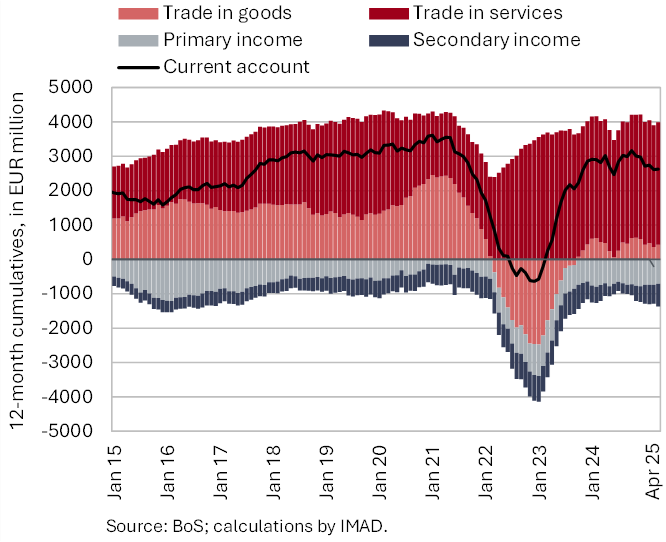
The 12-month current account surplus (until April) decreased by EUR 390,6 million compared to the previous 12-month period, amounting to EUR 2.6 billion (3.7% of estimated GDP). The largest contribution to the decline came from a higher secondary income deficit, primarily due to lower receipts from the EU budget for current international cooperation. The decrease in the current account surplus was also driven by the balances of goods and services, as well as primary income balance. The lower goods surplus was affected by a higher deficit in trade with EU countries, while the services surplus declined mainly due to a drop in construction services and travel. The primary income deficit increased mainly as a result of lower net inflows from compensation of employees: earnings of Slovenian workers abroad decreased, while earnings of foreign workers in Slovenia increased. Net outflows from equity income were also higher.
Revenue (top figure) and expenditure (bottom figure) of the consolidated general government budgetary accounts, May 2025
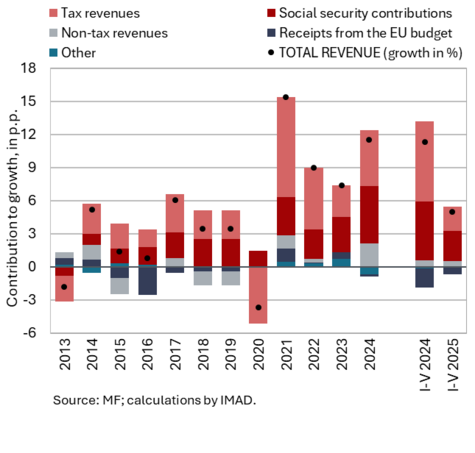
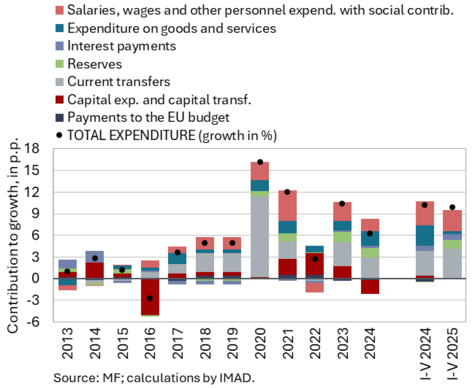
In the first five months of this year, the deficit of the consolidated balance of public finances was significantly higher year-on-year. It totalled EUR 633.1 million (EUR 77.3 million in the same period last year), and originated predominantly from the state budget, where a higher deficit than last year (EUR 795.9 million) is also planned at the annual level (EUR 1,866 million). Revenues in the first five months were 5% higher year-on-year, but their growth more than halved compared with the same period last year (11.3%). The strong revenue growth recorded last year was partly due to one-off factors (the introduction of the health contribution and the non-adjustment of personal income tax brackets to inflation). The strongest contribution to revenue growth this year came from social security contributions, while the contribution from tax revenues was slightly less pronounced – particularly from personal income tax and value added tax revenues, where growth has slowed considerably this year. Due to the April settlement of tax liabilities, corporate income tax revenues dropped sharply this year. Total receipts from the EU budget were lower year-on-year. Year-on-year growth in expenditure (10.0%) in the first five months was similar to the same period last year (10.2%). The bulk of the increase stemmed from: wages and other work-related income, which are affected by the public sector pay reform (implemented in January this year); current transfers to individuals and households; and other current transfers (agricultural subsidies, transfers for the provision of public utility services in public transport), as well as expenditure on reserves (funding of budgetary funds). Investment expenditure was also somewhat higher than last year.
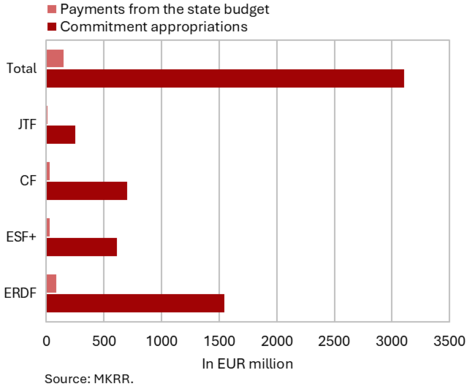
EU budget receipts, May 2025 (top figure) and absorption of funds under the Cohesion policy programme 2021–2027 (EU part) for the period 1 January 2021–31 May 2025 (bottom figure)
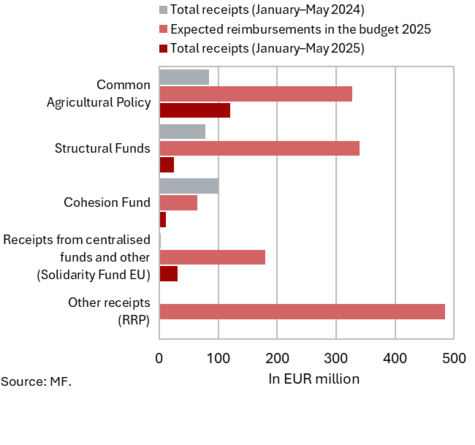
Slovenia’s net budgetary position against the EU budget was negative in the first five months of 2025 (at EUR 106.9 million). In this period, Slovenia received EUR 187.8 million from the EU budget (13.4% of receipts envisaged in the adopted state budget for 2025) and paid EUR 294.7 million into it (40.3% of planned annual payments). The bulk of revenue came from EU budget receipts for the implementation of the Common Agricultural and Fisheries Policy (63.9% of all reimbursements to the state budget, 36.6% of the planned reimbursements in 2025) and for the implementation of centralised and other EU programmes (16.5% of all reimbursements to the state budget, 17.2% of the planned reimbursements in 2025), most of which were under the Connecting Europe Facility. Reimbursements from the structural funds amounted to 13.6% of all reimbursements (7.5% of the planned reimbursements in 2025). At the end of June, the Office of the Republic of Slovenia for Recovery and Resilience submitted the fourth payment request to the European Commission under the Recovery and Resilience Facility, in the gross amount of EUR 502 million. According to the Information on the Implementation of the Recovery and Resilience Plan (June 2025), one more payment request is planned to be submitted to the European Commission this year, likely in late autumn. The highest payments into the EU budget came from GNI-based payments (46.7% of all payments).
According to the MKRR data, under the Operational Programme for the Implementation of EU Cohesion Policy 2021–2027 (from January 2021 to the end of May 2025), payments from the state budget totalled EUR 148.1 million (EU share), representing 5% of total available funds.