Slovenian Economic Mirror
Slovenian Economic Mirror 2/2026
Indicators of economic developments in the first months of the year pointed to an improvement in the export-oriented segment of the economy and in construction, while household consumption growth moderated. Exports of goods increased month-on-month in February for the second consecutive month, driven primarily by higher exports to non-EU countries, while in the first two months they were lower year-on-year. Manufacturing output also increased markedly in February, exceeding the level recorded a year earlier; however, in the first two months, it remained lower year-on-year (according to our estimate, this was primarily due to a pronounced decline in January in the pharmaceutical industry, which is characterised by significant monthly volatility). After several months of decline, the value of construction put in place strengthened in February and was a quarter higher year-on-year. Developments in trade and market services were more subdued. Real turnover in most trade sectors declined in January, while total real turnover in market services remained at the December level. Based on data on the nominal value of fiscally verified invoices, household consumption growth remained subdued in January and also February, but increased in March (excluding the sharp rise in motor fuel sales related to the conflict in the Middle East). Following a marked deterioration in February, the economic sentiment indicator improved slightly in March, particularly in retail trade and in manufacturing and services. Overall, economic sentiment in March remained weaker than a year earlier, with all confidence indicators lower except for consumer confidence. The number of persons in employment remained broadly unchanged in February; similarly, the number of unemployed did not change significantly in the early months of this year, but was slightly lower than at the end of last year. The sharp increase in the minimum wage in January led to an acceleration in year-on-year nominal growth of the average gross wage. Inflation slowed in March, mainly due to a base effect in electricity prices; the rise in petroleum product prices linked to the oil crisis has largely not yet been reflected in March inflation.
Economic sentiment (ESI) in the euro area, March 2026
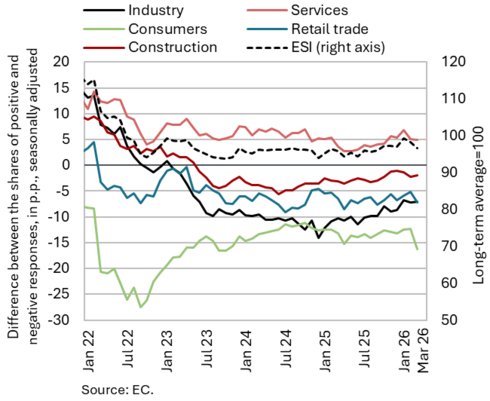
Economic sentiment indicators in the euro area deteriorated in March due to the war in the Middle East; however, on average in the first quarter, they still pointed to continued economic expansion. The average value of the composite Purchasing Managers’ Index (PMI) for the euro area in the first quarter (51.3) was slightly lower than in the previous quarter, but remained above 50, indicating an expansion in activity. The manufacturing PMI improved gradually from the beginning of the year and, on average (51.5), exceeded the level recorded in the previous quarter, while the services PMI declined in the first quarter (51.2) from the high level reached at the end of 2025 (53). Despite a noticeable decline in March, primarily due to lower consumer confidence, the Economic Sentiment Indicator (ESI) for the euro area remained, on average in the first quarter, higher than in the previous quarter. Compared with the previous quarter, confidence decreased only among consumers and in construction. Economic sentiment in the first quarter was also higher compared with the same period last year. In Germany, Slovenia’s largest trading partner, the Ifo Business Climate Index deteriorated markedly in March due to more pessimistic expectations and was, on average, lower than in the previous quarter.
IMF economic outlook, April 2026
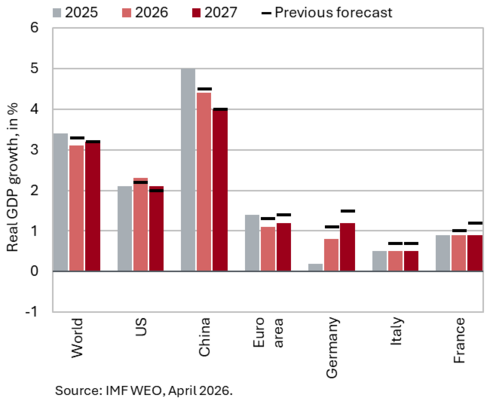
In its April forecast, the IMF slightly downgraded its baseline projections for global and euro area economic growth. Under the baseline scenario, which assumes a short-lived conflict in the Middle East (expected to fade by mid-2026) and a moderate 19% rise in energy prices in 2026, global economic growth is projected at 3.1% this year (a 0.2 p.p. downgrade from the IMF’s January forecast) and 3.2% next year. In the United States, growth is expected to increase to 2.3% this year, supported by fiscal policy and lower policy rates. For next year, the IMF projects US economic growth of 2.1%. Growth in China is projected at 4.4% this year (i.e. 1 p.p. lower than in the January forecast), before slowing to 4% next year. In the euro area, growth is expected to slow to 1.1% this year (1.4% last year) and then increase to 1.2% next year. Compared with the IMF’s January forecast, growth for both years has been revised down by 0.2 p.p., mainly due to the negative impact of the war in the Middle East (in particular the sharp increase in energy prices). The German economy is projected to grow by 0.8% this year (0.2% last year) and by 1.2% next year. According to the IMF, risks to the outlook remain tilted to the downside. A more prolonged or broader conflict in the Middle East, smaller-than-expected effects of artificial intelligence on productivity growth, or a renewed escalation of trade tensions could significantly weaken global growth and destabilise financial markets.
Commodity prices, March 2026
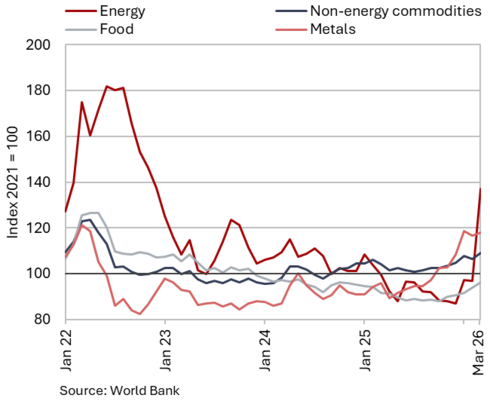
Brent crude oil and natural gas prices increased sharply in March due to the war in the Middle East, and the average price of non-energy commodities also rose. The average dollar price of Brent crude oil increased by 45.5% to USD 103.1 in March and the euro price by 48.9% to EUR 89.3. Year-on-year, oil prices were 41.8% higher in US dollars and 32.6% in euros. In dollar terms, oil prices in March reached their highest level since August 2022. The average euro price of natural gas on the European market (Dutch TTF) edged up by 63.1% to EUR 52.87/MWh in March, the highest level since January 2023. On a year-on-year basis, the price increased by 26.5%. Gas prices are currently exposed to higher risk also due to historically low storage levels in Europe. According to the World Bank, the average dollar price of non-energy commodities rose by 2.5% month-on-month in March and by 5% year-on-year. On a monthly basis, fertiliser prices increased the most (26.2%) and were also significantly higher year-on-year (42.5%). Metal prices were also considerably higher in March than a year earlier (23.0%).
Effective exchange rate, Q4 2025 (REER ulc) and Q1 2026 (REER hicp, ppi)
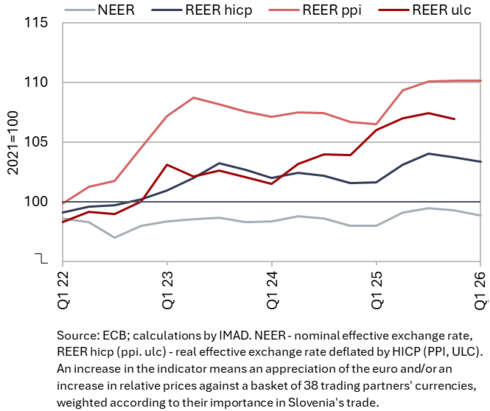
Values of the price and cost competitiveness indicators stabilised or improved slightly at the end of 2025; the first data for price competitiveness point to similar developments at the beginning of 2026. The cost competitiveness indicator (REER ulc) deteriorated during most of 2025, reflecting the appreciation of the euro, i.e. growth in the nominal effective exchange rate (NEER), and growth in relative unit labour costs (ULC). Among business sector activities, ULC increased more strongly than in the EU particularly in manufacturing. The rise in costs (ULC) also contributed to an increase in relative prices, which, together with the appreciation of the euro, led to a deterioration in price competitiveness in 2025, especially in the REER ppi indicator, which reflects the price competitiveness of manufacturing. In the fourth quarter of 2025, the values of the competitiveness indicators stabilised or improved slightly, with the depreciation of the euro (that is, a decline in the NEER) making a significant contribution; this trend continued in the first quarter of 2026. In addition, growth in relative costs (ULC) and relative prices (HICP) came to a halt at the end of the year, while producer price growth in manufacturing remained somewhat higher in the first quarter of this year than in Slovenia’s trading partners.
Short-term indicators of economic activity in Slovenia, January−February 2026
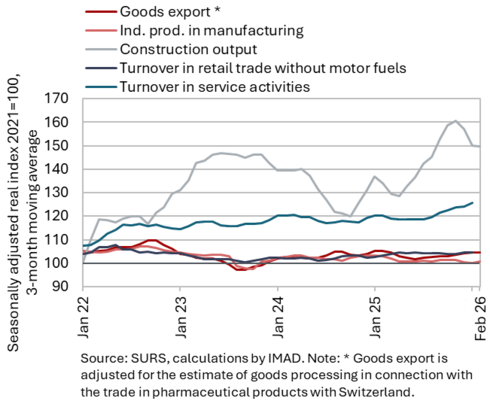
Activity in the export-oriented segment of the Slovenian economy increased at the beginning of the year on a month-on-month basis, while construction activity also strengthened. Manufacturing output increased markedly in February and exceeded the level recorded a year earlier; however, over the first two months as a whole, it remained lower year-on-year, mainly due to weaker output in high-technology industries. Output also decreased across all energy-intensive industries. Goods exports increased on a month-on-month basis in January and February, but remained lower year-on-year in the first two months of the year. The value of construction put in place increased in February and was one quarter higher than in the same month last year. After increasing in the fourth quarter of last year, real turnover in most trade sectors declined in January and was also lower year-on-year. Following growth in the fourth quarter of last year, total real turnover in market services remained at the December level in January and was higher year-on-year in all activities except transport.
Trade in goods – in real terms, February 2026
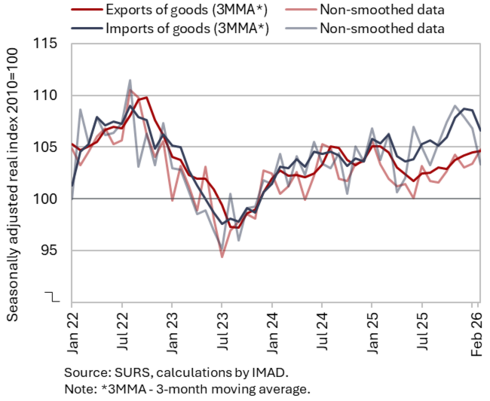
Goods exports increased month-on-month in February, while imports declined; in the first two months of this year, both were lower year-on-year. Real goods exports increased month-on-month for the second consecutive month in February (+1.3%). Growth was driven mainly by higher exports of goods to non-EU countries (Russia, the United Kingdom and the United States), while exports to Slovenia’s main EU trading partners declined in current terms. By product group, exports of pharmaceutical and chemical products, miscellaneous manufactured articles (scientific and control instruments and miscellaneous manufactured articles), and metals and metal products increased. Exports of vehicles, which exhibit more pronounced monthly volatility, and of other machinery and equipment declined; both developments were mainly related to lower exports to Germany and France. Real imports declined for the third consecutive month in February (–3.2%), mainly due to lower imports of certain energy commodities. Imports of intermediate goods (excluding imports of petroleum products and electricity) and consumer goods increased, while imports of capital goods declined (all seasonally adjusted). Compared with the same period last year, and with one fewer working day, real exports were 1.8% lower and imports 1.6% lower in the first two months.
Export orders remained at a very low level in March, similar to the preceding months.
Slovenia’s export market share in the EU market, Q4 2025
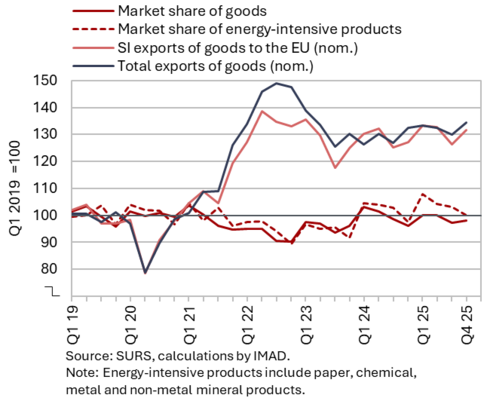
Slovenia’s export market share for goods on the EU market increased slightly year-on-year in the fourth quarter of 2025, while for 2025 as a whole it declined year-on-year. The year-on-year growth of the nominal value of Slovenia’s goods exports slightly exceeded the growth of EU goods imports in the fourth quarter of last year, after lagging behind it in the first three quarters. On average over the year as a whole, the market share declined particularly in exports of road vehicles, other machinery and equipment (including electrical equipment), and metals and metal products. Year-on-year growth in the market share of pharmaceuticals and some energy-intensive products (paper and pulp, and non-metallic mineral products) continued last year, but slowed in the second half of the year. A product and geographical decomposition of market share growth shows that in the fourth quarter of last year, the export structure did not differ significantly from the demand structure in the EU. At the end of last year, the market share increased in most of Slovenia’s main EU trading partners, but on average in 2025 it was lower particularly in France, Germany and Croatia. Over the year as a whole, the average market share in the EU market was 0.48% (-1%), and 0.53% (-2.5%) in manufacturing.
Trade in services – in real terms, February 2026
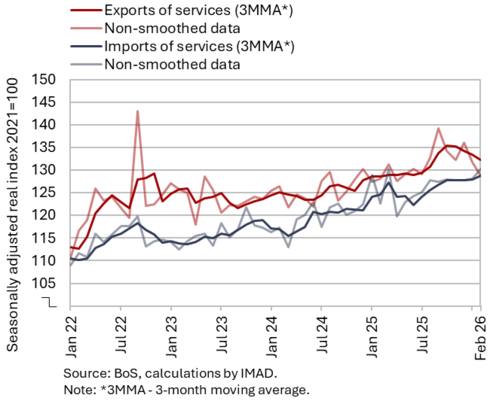
Real exports of services decreased month-on-month in February, while imports increased (seasonally adjusted); in the first two months, both were higher year on year. The monthly decline in exports (–2.3%) was driven mainly by a fall in exports of transport services, which have declined noticeably over the past two months, approaching their lowest levels in recent years. Exports of ICT services and insurance services also decreased, with the latter reaching the lowest level since June last year. Exports of tourism-related services remained at the level of the previous two months, while exports of other business services increased on a month-on-month basis. Services exports declined mainly to Austria and Germany in January and February, and additionally to Italy, Croatia and France in February. In services imports (+1.6%), imports of tourism-related services increased markedly, while imports of ICT and construction services also rose. Imports of transport and other business services decreased (all seasonally adjusted).
In the first two months, both exports and imports of services were higher year-on-year (by 1.9% and 2.7%, respectively). On the export side, exports of insurance services (Italy) made the largest contribution, increasing markedly in the second half of last year. Exports of other business services and tourism-related services were also higher. The import side showed a similar structure.
Production volume in manufacturing, February 2026
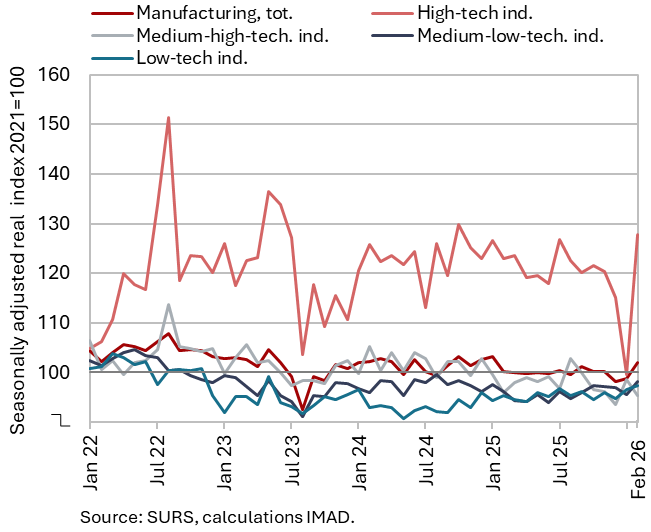
Manufacturing output increased markedly in February (3.1%, seasonally adjusted) and exceeded the level recorded a year earlier; however, in the first two months it remained 1.2% lower year-on-year (working-day adjusted). On a monthly basis, output increased in low-, medium-low- and high-technology industries, exceeding year-earlier levels in all of them. In the first two months combined, output in high-technology industries remained significantly lower year-on-year (by 11%, non-adjusted), primarily due to a sharp decline in January, with the contraction concentrated in our estimate mainly in the pharmaceutical industry. Output in medium-high-technology industries declined in current terms in February and was slightly lower year-on-year over the first two months. Within these industries, output was lower in the manufacture of electrical equipment, the manufacture of motor vehicles and (semi-)trailers, as well as in the energy-intensive chemical industry (by around one tenth). Output in other energy-intensive industries, classified as low- and medium-low-technology industries, was also lower year-on-year after the first two months: by one fifth in the paper industry, and by around 6.5% in the manufacture of non-metallic mineral products and in the manufacture of basic metals.
The outlook in manufacturing remained subdued in March (similar to a year earlier) amid increased uncertainty.
Activity in construction, February 2026
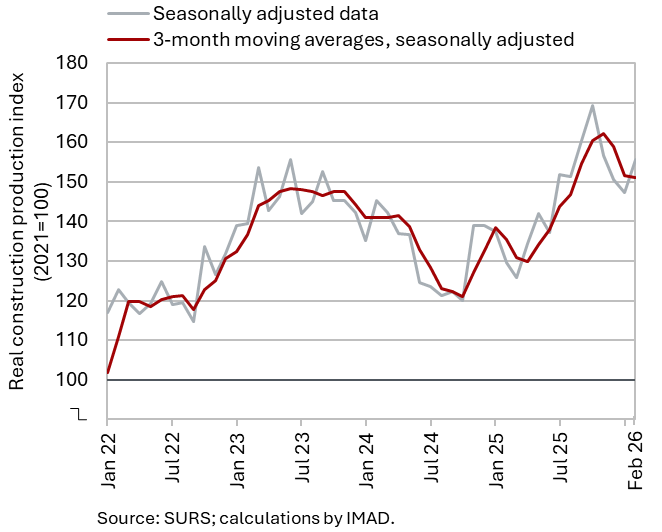
The value of construction put in place increased in February (seasonally adjusted) and was also higher year-on-year (24%). After strong growth in mid-2025, construction activity peaked in October, declined until January this year, and then strengthened again in February (5.5%, seasonally adjusted). This dynamic was primarily driven by developments in civil engineering works.
Some other data point to more moderate movements in construction activity. According to VAT data, activity in February was 16% higher year-on-year, which is 8 p.p. points lower than indicated by data on the value of construction work put in place. Similarly, data on output in the manufacture of non-metallic mineral products, which is traditionally closely linked to construction, do not indicate such strong growth, with production declining by 7% year-on-year in February.
Value of fiscally verified invoices, March 2026
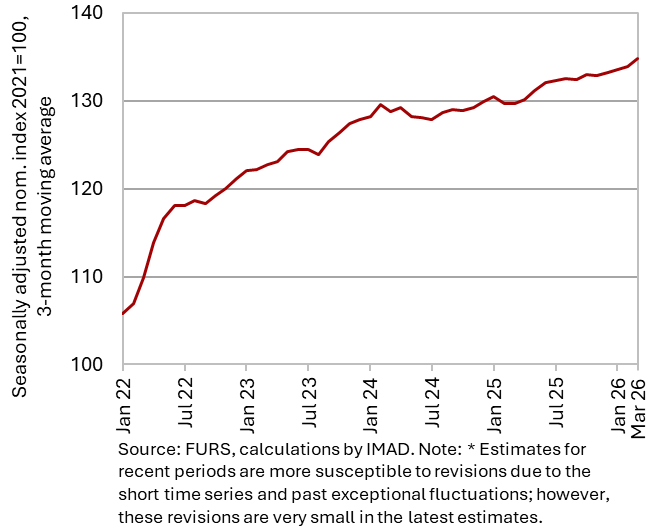
Growth in the nominal value of fiscally verified invoices accelerated in March, both month-on-month and year-on-year, primarily due to a strong increase in motor fuel sales. With one more working day than in March 2025, year-on-year growth was the highest this year (2% in January and 3% in February). Turnover growth in retail trade was high (9%), with this segment accounting for three quarters of the total value of fiscally verified invoices. This was primarily related to increased sales of motor fuels in retail trade due to anticipated price rises following the increase in global oil prices, as well as lower fuel prices compared to neighbouring countries. Growth was also somewhat higher than in February in most other retail trade sectors, and it was also strong in wholesale trade. Year-on-year growth remained relatively high in accommodation and food service activities (8%), which accounted for nearly one tenth of the total value of fiscally verified invoices. By contrast, sales growth in cultural, sports, recreational and other activities was significantly lower than in February (2%).
Turnover in trade, January 2026
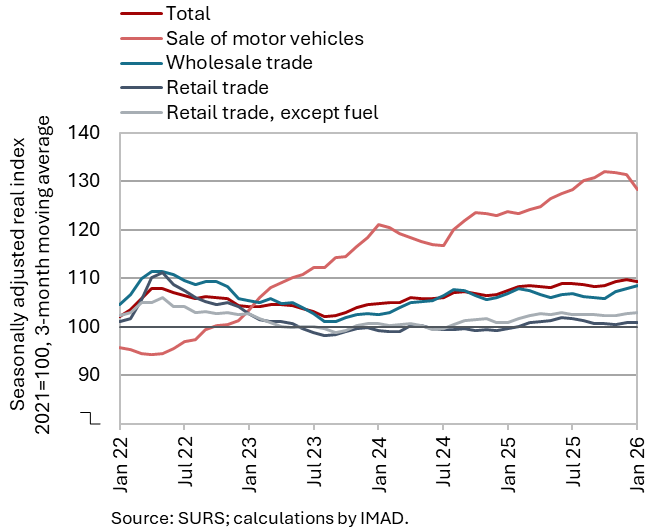
After increasing in the fourth quarter of last year, real turnover in most trade sectors declined in January and was also lower year-on-year. In motor vehicle sales, turnover decreased for the third consecutive month, following strong growth up to October last year. After relatively strong growth in December, retail trade in food and non-food products also declined. Wholesale turnover remained broadly unchanged from its Q4 2025 level, when it had strengthened considerably (seasonally adjusted). Year-on-year, sales declined across all trade sectors except retail trade in non-food products. The largest decline was recorded in motor vehicle sales, which, amid a 9% increase in sales of new passenger cars, recorded the fastest real growth last year (7%).
Turnover in market services, January 2026
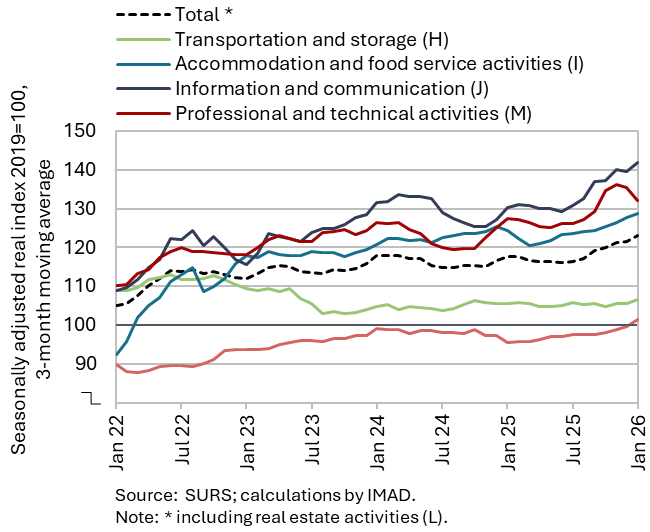
After increasing in the fourth quarter of last year, total real turnover in market services remained at the December level in January (seasonally adjusted), while it remained higher year-on-year. In accommodation and food service activities, turnover has been increasing since last spring, and in information and communication since the second half of last year. In professional and technical activities, turnover has been declining since the fourth quarter of last year after several months of growth, particularly in architectural and engineering services. In transportation and storage, turnover has stagnated since the end of 2024. In administrative and support service activities, turnover in January, following gradual growth since the beginning of last year, increased noticeably and slightly exceeded its 2019 level (all seasonally adjusted). Total real turnover was 3.8% higher year-on-year in January; only in transportation was it slightly lower than a year earlier (by 1.3%).
Selected indicators of household consumption, Q1 2026
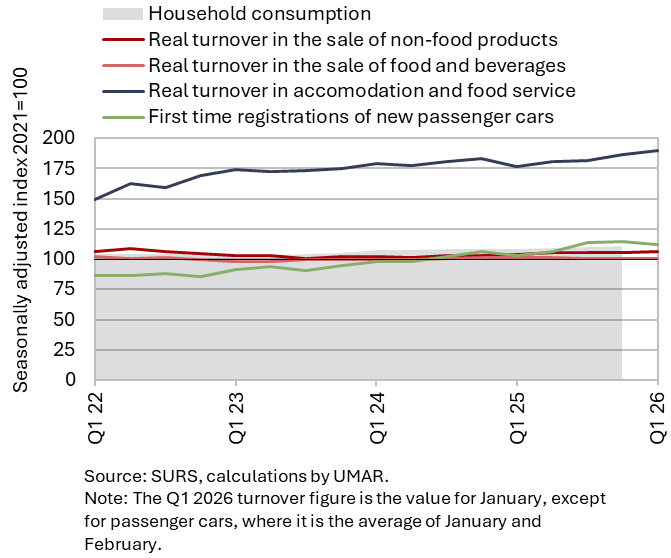
Available data indicate that household consumption growth was moderate at the beginning of the year, picking up somewhat in March. After relatively strong growth at the end of last year, households spent less year-on-year in January on food, beverages and tobacco, but more on non-food products. Year-on-year, spending on tourism services increased in January and February both abroad (nominally by 11%, with the number of overnight stays by Slovenian citizens in Croatia rising by 12%) and in Slovenia (the number of domestic overnight stays in Slovenia was higher by 5%). The number of new passenger cars purchased by households was also slightly higher in this period (by 1%).
Data on the nominal value of fiscally verified invoices also indicate moderate growth in household consumption in January and February (as reflected in preliminary data on retail trade turnover for February), while an increase was recorded in March (excluding the sharp rise in motor fuel sales related to the conflict in the Middle East).
Electricity consumption by consumption group, March 2026
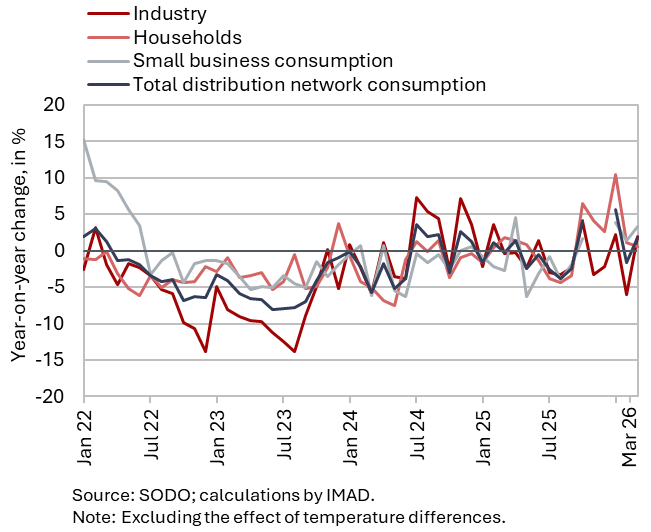
Electricity consumption in the distribution network was 1.8% higher year-on-year in March. Industrial consumption and consumption by other business consumers – both indicative of economic activity – increased year-on-year by 2% and 3.3%, respectively, partly reflecting one additional working day. Household consumption was also slightly higher than a year earlier (0.6%).
Real estate, Q4 2025
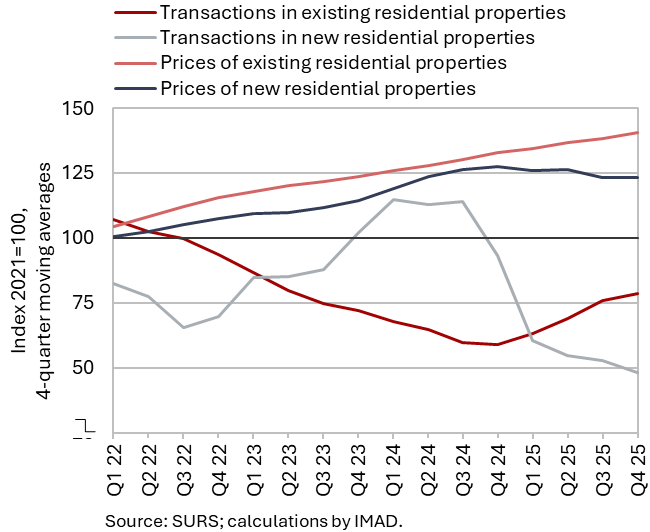
Growth in dwelling prices moderated last year amid higher transaction volumes. On average in 2025, prices increased by 4.3%, down from around 7.5% in 2023 and 2024. Prices of existing dwellings, where the number of transactions increased by one-third from the lowest level recorded in 2024, rose by 5.8% year-on-year (by 7.4% in the previous year). By contrast, prices of newly built dwellings were lower than a year earlier (by 3.3%, following growth of just over 10% on average in 2024), although these accounted for only 4% of all transactions. Average dwelling prices were 110.6% higher than in 2014, when they reached their trough. Over the same period, consumer prices increased by 29.7%, while the average net wage rose by almost 60%.
Road and rail freight transport, Q4 2025
The volume of road and rail freight transport, which has been mostly declining since 2022, also contracted in the fourth quarter of 2025. The total volume of road freight transport decreased by 8% quarter-on-quarter (seasonally adjusted) and by 15% year-on-year. In road transport performed by Slovenian vehicles, the volume of cross-trade increased for the third consecutive quarter (following a sharp decline in the first quarter), while the volume of transport at least partly taking place on Slovenian territory (exports, imports and national transport) declined markedly. The share of cross-trade in total transport was 44%, which is 7 p.p. lower than in the pre-pandemic period. Rail freight transport in Slovenia declined by 7% in the fourth quarter (seasonally adjusted) and by 9% year-on-year. In 2025, the volume of road and rail freight transport was almost one fifth lower than in 2019.
Economic sentiment, March 2026
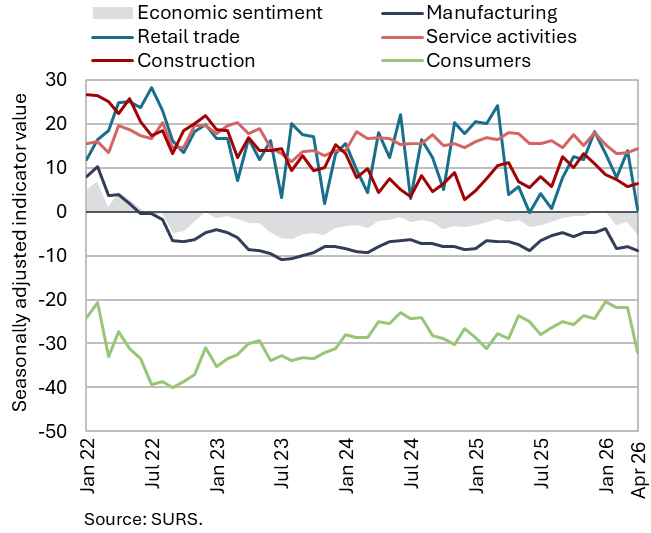
The economic sentiment indicator improved slightly month-on-month in March, following a marked deterioration in February. Having strengthened since September last year, the indicator declined sharply in February, falling below its year-earlier level for the first time since August 2025 and dropping below its long-term average. In March, it edged up slightly month-on-month, supported by stronger confidence in retail trade, manufacturing and services. Confidence in construction deteriorated further, while consumer confidence remained unchanged from the previous month. Overall, economic sentiment in March remained weaker than a year earlier, with all confidence indicators lower except for consumer confidence.
Households facing financial distress, March 2026
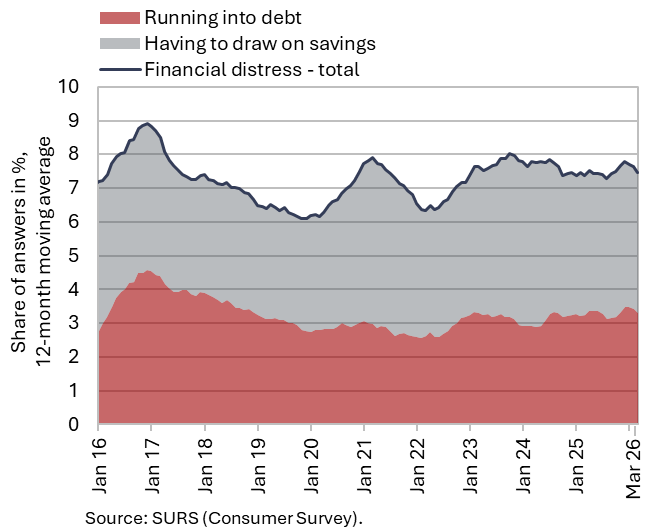
The financial situation of households improved in the first quarter of 2026, both quarter-on-quarter and year-on-year. Among households facing financial distress, the proportion of those running into debt and those having to draw on savings to meet their needs declined both quarter-on-quarter and year-on-year. In our assessment, the improvement was significantly supported by high employment and wage growth, as well as by the payment of the winter holiday bonus for employees and pensioners. The share of households facing financial distress in the lowest income quartile decreased by 1.2 p.p. compared to the fourth quarter of last year and by 0.3 p.p. year-on-year, to 11.9%. The financial position also improved for households in the second income quartile (by 3.9 p.p. quarter-on-quarter and 2.4 p.p. year-on-year, to 6.7%) and the third income quartile (by 4.5 p.p. quarter-on-quarter and 2.8 p.p. year-on-year, to 3.4%).
Number of persons in employment, February 2026
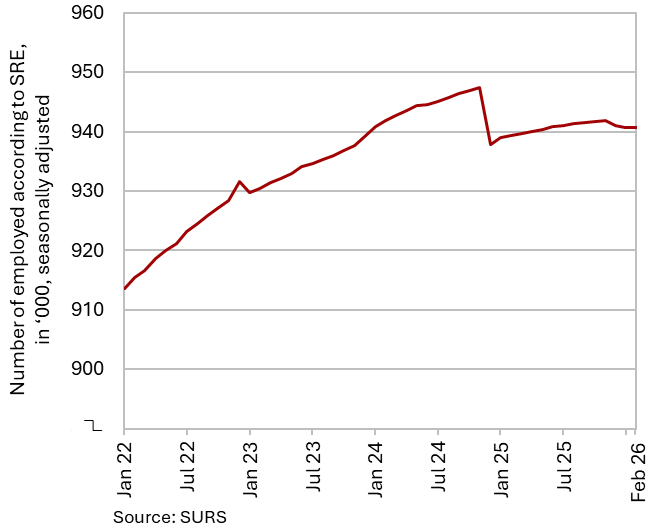
According to the Statistical Register of Employment (SRDAP), the number of persons in employment in February remained broadly unchanged compared with previous months (seasonally adjusted) and was also similar to the level a year earlier. The number of employees declined slightly year-on-year (–0.1%), while the number of self-employed increased (1%). The largest year-on-year declines in the number of persons in employment were recorded in manufacturing (–1.5%) and trade (–1.3%). By contrast, the number of persons in employment increased in public service activities, particularly in human health and social work activities (3.7%). The number of foreign nationals in employment increased by 2.3% year-on-year in February, while the number of Slovenian nationals in employment declined by 0.4%, mainly due to retirements.
Number of registered unemployed, March 2026
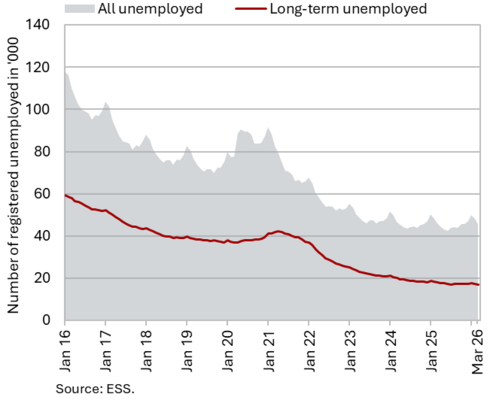
The number of unemployed persons in March remained similar to the previous two months and slightly lower than at the end of last year (-0.7%, seasonally adjusted). According to original data, 45,760 people were unemployed at the end of March, 4.9% less than at the end of February. Year-on-year, unemployment declined by 0.2%. The year-on-year decline in the number of long-term unemployed (–5.8%) was similar to that recorded in previous months, while the decrease in the number of unemployed persons aged over 50 (–3.3%) was slightly smaller. The number of unemployed young people (aged 15–29), which has recorded year-on-year increases since October 2024, exceeded its level from a year earlier by 5.4%, reaching 9,881 persons.
Average nominal gross wage per employee, January 2026

Year-on-year nominal growth in the average gross wage was high in January (6.7%), driven mainly by strong growth in the private sector (7.2%) and, to a lesser extent, in the public sector (5.5%). Growth in the private sector was primarily influenced by a 16% increase in the minimum wage. Compared to previous months, year-on-year wage growth accelerated particularly in trade, accommodation and food service activities, administrative and support service activities (including employment agencies), and construction, i.e. activities with a relatively higher share of minimum wage recipients. In the public sector, growth remained relatively high, linked to the wage reform, the agreed increase in base wages at the beginning of last year, and collective bargaining agreements.
In real terms, the average gross wage increased by 4% year-on-year in January – by 4.5% in the private sector and 2.8% in the public sector.
Number of FSA beneficiaries and UB recipients, February 2026

The number of unemployment benefit (UB) recipients and the number of financial social assistance (FSA) beneficiaries declined again year-on-year in February. There were 16,471 UB recipients, which is similar to January and higher than in December last year (by 2%, seasonally adjusted), mainly due to a seasonally driven higher inflow into unemployment following the expiry of fixed-term employment contracts. Year-on-year, however, their number was 2.6% lower (34.2% of all unemployed; 35.0% in February last year). Amid a decline in the number of long-term unemployed persons, who are often eligible for FSA, the year-on-year decrease in the number of FSA beneficiaries also continued. In February, 70,413 persons were eligible for FSA, 2.4% fewer than a year earlier, representing a lower decline than in recent months.
Consumer prices, March 2026
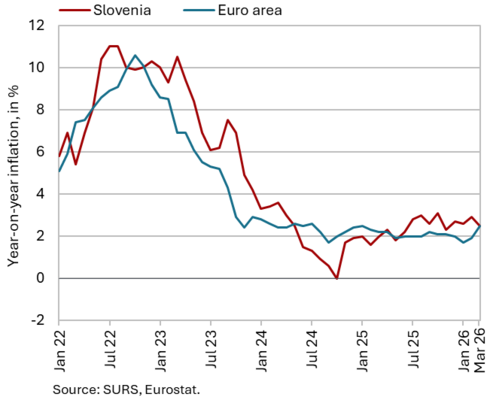
Year-on-year growth in consumer prices slowed to 2.5% in March; for the second consecutive month, price dynamics were primarily influenced by a base effect related to electricity prices. In March 2025, electricity prices increased by 16.5%, despite the shift to the low tariff season, following the expiry of the Act on emergency measures to mitigate the impact of high network charges for households. As a result, year-on-year price growth in the housing, water, electricity, gas and other fuels group declined by around 5 p.p., to 5.8% in March. Year-on-year growth in food and non-alcoholic beverage prices also eased (2.6%). Price growth for non-energy industrial goods remained moderate. Prices of semi-durable goods remained almost unchanged year on year in March (–0.1%), while prices of durable goods were 0.5% higher. Primarily due to the monthly increase in motor fuel prices (2.7%), the negative year-on-year contribution of the transport group narrowed slightly (by 0.2 p.p.). In March, year-on-year growth in services prices strengthened (3.7%), driven mainly by nearly 10% higher prices of insurance and financial services, which have increased by 11.3% over the past four months. In the last two months, year-on-year price growth in the restaurants and accommodation services group strengthened somewhat (3.1%).
Slovenian industrial producer prices, February 2026
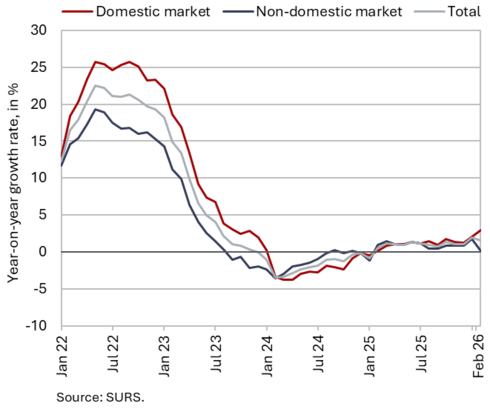
In February, Slovenian industrial producer prices remained unchanged month-on-month, while year-on-year growth slowed to 1.5% (from 1.9%). This slowdown was mainly due to a more marked moderation in price growth in foreign markets, which, amid a month-on-month price decline and, in particular, a relatively high base from the previous year, remained almost unchanged year-on-year (0.1% growth). Year-on-year price growth on the domestic market increased compared to January by nearly half, reaching 2.9%. More than two-thirds of the increase was driven by higher prices of raw materials (2.3% year-on-year) and consumer goods (3.5%). Growth in the prices of the latter moderated somewhat and was the lowest since June last year. The most pronounced increase was recorded in energy prices (5.7%). Prices of capital goods were also higher year-on-year (1.5%).
Loans to domestic non-banking sectors, February 2026
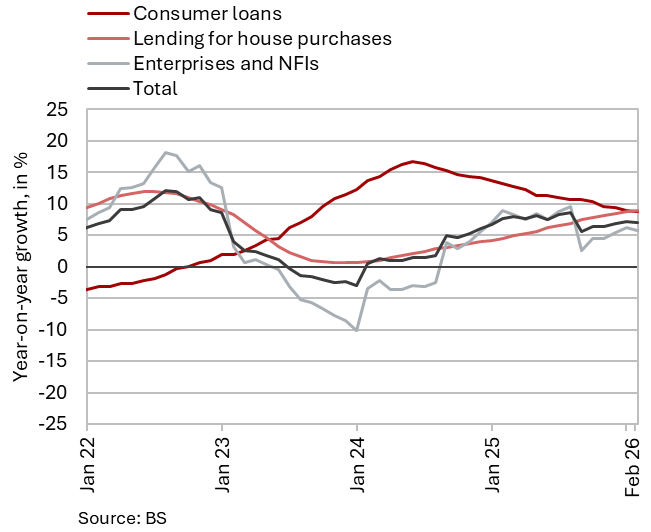
Year-on-year growth in the volume of loans to domestic non-banking sectors remained unchanged at 7% in February. Growth in loans to enterprises and NFIs slowed somewhat (5.7%). Growth in loans to households (7.8%) has been gradually strengthening, driven by increased growth in housing loans (8.9%); the volume of new housing loans in the first two months was approximately one-third higher than in the same period last year. Growth in consumer loans is gradually moderating, but at 8.8% in February it remained relatively high. Year-on-year growth in non-banking sector deposits (6.4% in February) declined somewhat this year. This was mainly due to a decrease in short-term deposits, which were still around 2% higher year-on-year in December, but fell by 6.2% year-on-year in February. Growth in overnight deposits remains stable (slightly above 9%). The share of non-performing exposures in the banking system, after increasing at the end of last year – when it rose somewhat, particularly in manufacturing – remained at 1.6% in January.
Bond, Q1 2026
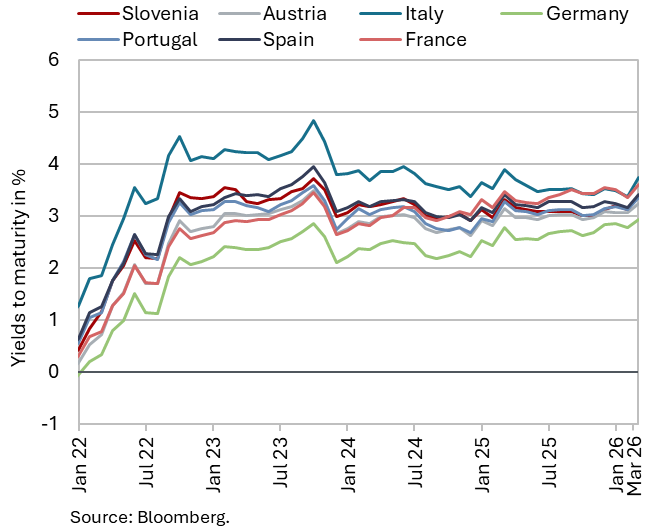
In the first quarter, the yield to maturity of the Slovenian government bond increased by 20 basis points, to 3.25 %. Yields also increased in other euro area countries. The increase was most pronounced in March, in response to the war in the Middle East and the associated stronger inflationary pressures. The spread to the German bond widened by 6 basis points, to 39 basis points.
Current account of the balance of payments, February 2026
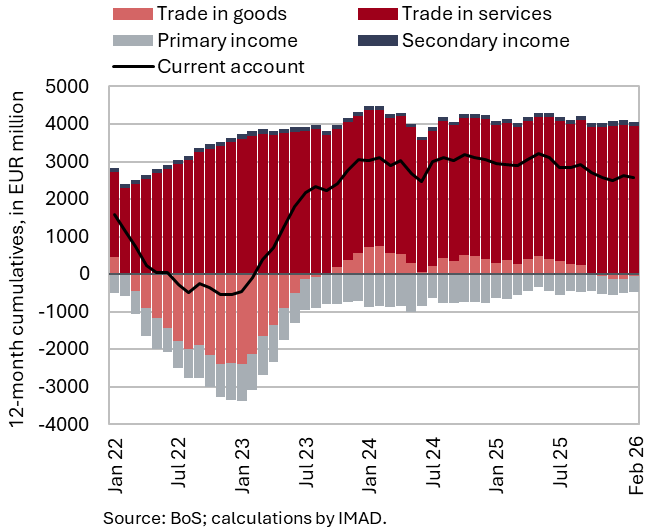
The 12-month current account surplus (up to February) was lower than in the previous 12-month period (EUR 2.9 billion), amounting to EUR 2.6 billion (3.7% of estimated GDP). This change was driven by developments in the goods balance and the secondary income balance. Amid stagnating exports and a slight increase in imports, the goods balance shifted into a deficit, while the wider secondary income deficit primarily reflected lower general government receipts from the EU budget. The services surplus remained elevated and increased primarily in insurance services, reflecting the expansion of a Slovenian insurance company’s business volume and related services in the Italian motor insurance market. Higher surpluses were also recorded in transport and travel. The primary income deficit narrowed, mainly due to smaller net outflows of income from equity (dividends and profits); in addition, net labour income from abroad also increased.
Revenue (top figure) and expenditure (bottom figure) of the consolidated general government budgetary accounts, February 2026
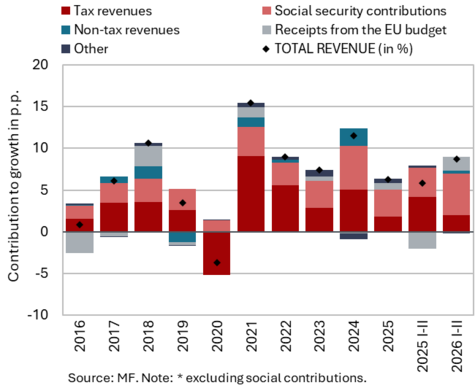
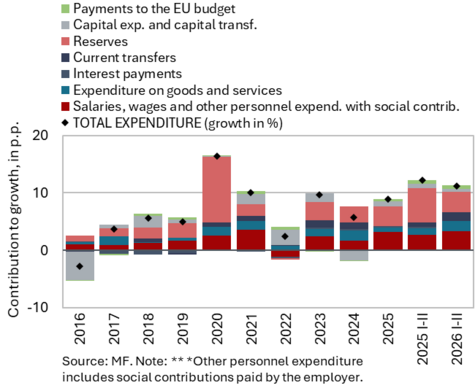
In the first two months of 2026, consolidated general government balance recorded a deficit of EUR 133 million, which is EUR 112 million more than in the same period last year. In the first two months, revenues increased by 8.8%, which is more than in the same period of 2025 (5.9%). Year-on-year growth strengthened particularly in social contributions, reflecting the introduction of the long-term care contribution in July last year. Revenue from VAT and EU funds (for the implementation of the Recovery and Resilience Plan) also increased significantly. By contrast, revenue from excise duties and corporate income tax was lower year-on-year. Expenditure in the first two months of 2026 was 11.2% higher year-on-year, representing a somewhat smaller increase than in the same period of 2025 (12.2%). The increase in expenditure was driven mainly by higher compensation of employees due to the implementation of the wage reform and by transfers. The increase in transfers to individuals and households was driven primarily by higher expenditure on pensions and unemployment benefits, following their increase at the beginning of this year; transfers for the provision of public service in scheduled passenger transport have also continued to rise, reflecting newly awarded concessions. Investment expenditure was also higher year-on-year, particularly for the purchase of military equipment and for investment in new construction, reconstruction and renovation.
EU budget receipts, February 2026
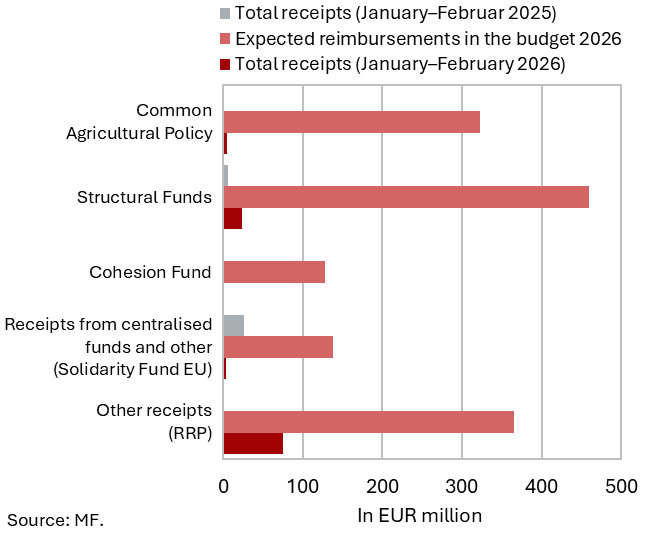
Slovenia received EUR 106.6 million in the first two months of 2026, while its net position was negative (EUR 43 million). In the first two months, Slovenia received EUR 106.6 million from the EU budget, i.e. EUR 74.1 million more than in the same period last year. In the same period, it contributed EUR 149.5 million to the EU budget (EUR 119.4 million in 2025). The higher inflows are mainly related to the implementation of the Recovery and Resilience Plan (EUR 75.2 million) and projects financed from the Structural Funds (EUR 23 million). On the basis of the fifth payment request under the Recovery and Resilience Facility, submitted in December last year, Slovenia is expected to receive an additional EUR 230.7 million from the EU budget in April (taking into account pre-financing already received). In March 2026, it also submitted the sixth (penultimate) request, with a maximum possible net disbursement of around EUR 41 million.