Slovenian Economic Mirror
Slovenian Economic Mirror 7/2025
Activity in most sectors in Slovenia has strengthened on a month-on-month basis since mid-year. The strongest increase was recorded in construction activity, particularly construction investment in infrastructure and non-residential buildings. After contracting in the first half of the year, real goods exports and manufacturing output also rose in the third quarter, while turnover in market services increased on average in July and August. The economic sentiment indicator has been improving since mid-year. By October, confidence had strengthened across all sectors, albeit only modestly in manufacturing, where the confidence indicator has not yet surpassed its long-term average. The consumer confidence indicator also remained below its long-term average. The number of persons in employment remained broadly unchanged at the end of the third quarter relative to previous months, while the number of unemployed increased slightly again at the beginning of the fourth quarter. Year-on-year growth in gross wages strengthened slightly in September, driven by higher growth in the public sector, which in our assessment is related to the payment of the supplement for teaching and pedagogical duties. In the private sector, where wages continue to be influenced by excess demand for labour, their growth remained relatively high. Year-on-year inflation increased in October mainly due to the impact of last year’s lower base. In October last year, a new system for calculating the electricity network charge was introduced, and it began to be applied during the cheaper summer season. Prices of food and non-alcoholic beverages, which were around 7% higher than a year earlier, continued to contribute the most to inflation.
Quarterly GDP growth in Slovenia’s main trading partners

In the third quarter, euro area GDP increased by 0.2% quarter-on-quarter and by 1.4% year-on-year (both seasonally adjusted). The strongest contribution to the quarterly acceleration came from France, where year-on-year growth reached a two-year high (0.5%, 0.9% year-on-year). This was primarily driven by stronger net exports, supported by increased output in the aviation and refinery industries. Among Slovenia’s main trading partners, Austria also recorded GDP growth in the third quarter (0.1% quarter-on-quarter, 0.6% year-on-year), with quarter-on-quarter growth supported by private consumption, while investment and net exports declined. In Germany, GDP was flat in the third quarter (0.3% higher year-on-year) after a 0.2% contraction in the previous quarter, amid falling exports and higher investment in machinery and equipment. Italy’s GDP likewise stagnated in the third quarter (up 0.4% year-on-year), reflecting a positive contribution from net exports and lower domestic demand. In the first nine months, GDP in the euro area was up 1.5% year-on-year.
Composite Purchasing Managers’ Index (PMI) for the euro area, October 2025

Economic sentiment indicators at the beginning of the fourth quarter suggest a continued strengthening of activity in the euro area. The composite Purchasing Managers’ Index (PMI) reached its highest level in two and a half years in October (52.5), with both components (manufacturing and services PMI) contributing to the improvement. The economic sentiment indicator (ESI) for the euro area also reached its highest level since mid-2023 in October, with confidence strengthening relative to September across all activities and among consumers. Compared to the same period last year, industrial confidence indicator improved markedly. In Germany, Slovenia’s most important economic partner, the composite PMI similarly climbed in October to a two-and-a-half-year high (53.9). In particular, the services PMI strengthened, and the manufacturing PMI, still largely supported by the capital goods sector, also remained above 50 (the threshold between expansion and contraction). The Ifo Business Climate Index for Germany likewise improved, driven mainly by firms’ more optimistic expectations regarding business conditions in the coming months, especially in industry.
Commodity prices, October 2025
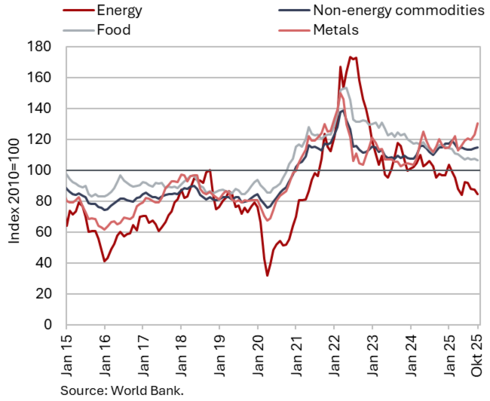
Brent crude oil prices decreased on average in October compared with September, while the average price of non-energy commodities remained unchanged. The average dollar price of Brent crude oil fell by 5.1% to USD 64.54 and the euro price by 4.2% to EUR 55.5. The relatively low price level is partly attributable to the OPEC+ decision to raise production quotas. Year-on-year, the price of oil was 14.7% lower in US dollars and 20% lower in euros. The average euro price of natural gas on the European market (Dutch TTF) fell further in October amid high storage levels in Europe, decreasing by 1.3% to EUR 31.9/MWh, reaching its lowest level in the past year and a half; on a year-on-year basis, it was 21% lower. According to the World Bank, the average dollar price of non-energy commodities remained unchanged both month-on-month and year-on-year in October. Prices of most main commodity groups declined month-on-month, while metal prices rose sharply (+5.5%). On a year-on-year basis, prices of fertilisers, metals, and beverage raw materials (notably coffee) remain substantially higher, while food prices declined.
Gross domestic product, Q3
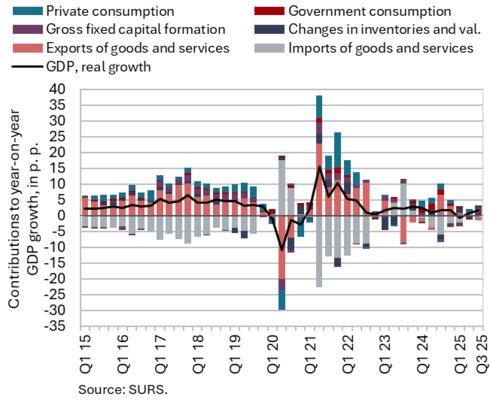
The Slovenian economy continued to expand in the third quarter of this year. GDP rose by 0.8% quarter-on-quarter (seasonally adjusted) and by 1.7% year-on-year. Year-on-year growth in private consumption eased slightly (1%), yet it remained an important driver of this year’s growth. Gross fixed capital formation increased markedly year-on-year (9.1%) after contracting in the first half of the year. Investment in infrastructure and non-residential buildings increased substantially, while investment in residential buildings remained lower than a year ago. Following a decline in the previous quarter, general government consumption rose by 1.2% year-on-year, primarily due to the fading impact of last year’s elevated base associated with post-flood reconstruction expenditures. With exports declining year-on-year (–1.1%) and imports rising (0.7%), external trade balance made a negative contribution to GDP growth (–1.4 p.p). The contribution of inventories, which had been revised sharply downward for the first half of the year, turned positive in the third quarter (0.6 p.p.). In the first nine months, GDP was up 0.7% year-on-year.
Electricity consumption by consumption group, October 2025
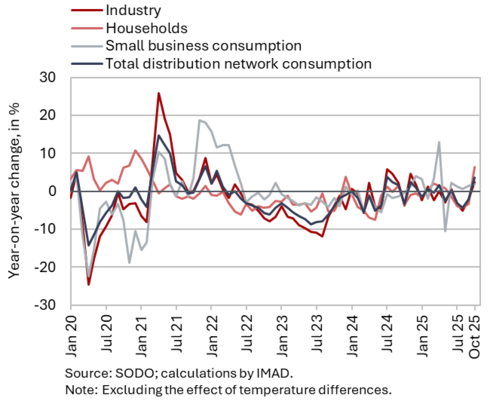
Electricity consumption in the distribution network was 3.6% higher year-on-year in October. With the same number of working days, industrial consumption, which can serve as an indicator of economic activity, was 1.7% lower month-on-month, while it was 2.5% higher year-on-year. Household consumption and small business consumption were higher year-on-year (by 6.5 and 1.8% respectively).
Trade in goods – in real terms, September 2025
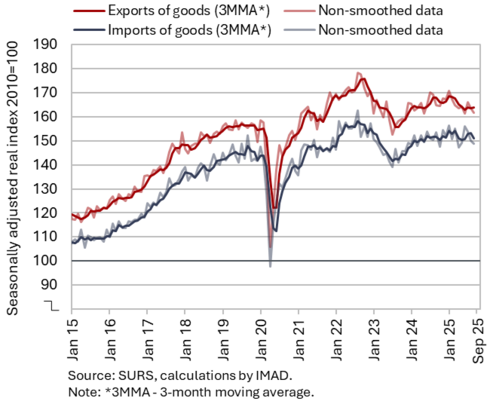
In the third quarter of 2025, real exports of goods increased compared with the previous quarter, while imports remained broadly unchanged (seasonally adjusted); on a year-on-year basis, exports was lower, while imports was higher. The quarterly growth in exports (1.3%) was primarily driven by a strong increase in July, followed by declines in August and September. In the third quarter, exports to EU Member States rose, while exports to non-EU markets decreased, most notably to the United States. Exports of road vehicles increased markedly, with this category typically exhibiting pronounced monthly and quarterly volatility, particularly exports to France. Exports of pharmaceutical products and other machinery and equipment also strengthened. After a sharp decline in the previous quarter, exports of metals and metal products also edged up slightly, while exports of other materials decreased. On the import side, imports of consumer and capital goods rose month-on-month, while imports of intermediate goods declined for the second consecutive quarter (all seasonally adjusted). Year-on-year, exports was lower in the third quarter (–1.7%), partly due to a high last year’s base. In the first nine months of this year, however, it was 0.5% lower. Imports were higher year-on-year in the third quarter and in the first nine months (0.8% and 0.6%, respectively).
Goods exports continue to be constrained by weak demand in manufacturing sectors of Slovenia’s key trading partners, as export order books also remain subdued. At the beginning of the fourth quarter, companies again cited uncertain economic conditions and weak domestic and foreign demand among the main factors limiting activity in manufacturing.
Trade in services – in real terms, September 2025
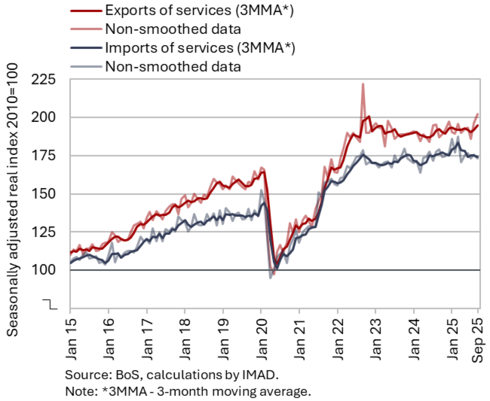
In the third quarter, real imports and exports of services increased quarter-on-quarter, while they were both lower year-on-year in the first nine months. The quarterly expansion of exports (0.5%) was driven primarily by stronger exports of administrative and support service activities, although this category has exhibited considerable volatility in recent months. Exports also rose markedly in several other service groups, which represent a smaller share in total services exports (personal, cultural and recreational services), and in ICT services. Exports of transport services decreased for the third consecutive quarter, and exports of tourism-related services were also lower than in the previous quarter. Imports of services declined (0.7%); imports of other business services and ICT services increased, while imports of most other main groups of services were lower (all seasonally adjusted).
In the third quarter, exports of services were similar to the same period last year (0.1%); growth slowed somewhat in most main groups of services. This year, export growth has been driven primarily by business and ICT services, while tourism-related services increased more modestly and were broadly unchanged year-on-year. Exports of transport and construction services were lower than in the same period last year. Following strong growth at the beginning of the year, service imports declined year-on-year for the second consecutive quarter (–0.5%). In the first nine months, exports and imports of services were on average higher year-on-year in real terms (by 1.8% and 2.3% respectively).
Production volume in manufacturing, September 2025

After contracting in the first half of the year, manufacturing output increased slightly in the third quarter (seasonally adjusted), and after declining in the first half of the year, it remained largely unchanged year-on-year. In the third quarter, output increased across all groups of industries by technological intensity (seasonally adjusted). Year-on-year, output in high-technology and low-technology industries remained higher, and in the first nine months it also exceeded the levels recorded a year earlier. However, output in medium-high-technology and medium-low-technology industries remained lower year-on-year in the third quarter as well; in the first nine months, it declined by an average of around 2.5% year-on-year. Output in the manufacture of motor vehicles and other transport equipment was one tenth lower than in the first nine months of last year, while it fell by around 5% in the metal industry. Only in the chemical and rubber industries and in the repair and installation of machinery and equipment was the production slightly higher year-on-year. Manufacturing output in the first nine months was, on average, 1.0% lower than a year earlier (working-day adjusted).
Since mid-year, the confidence indicator in manufacturing has also improved somewhat, mainly due to an improvement in the expected production indicator.
Activity in construction, September 2025
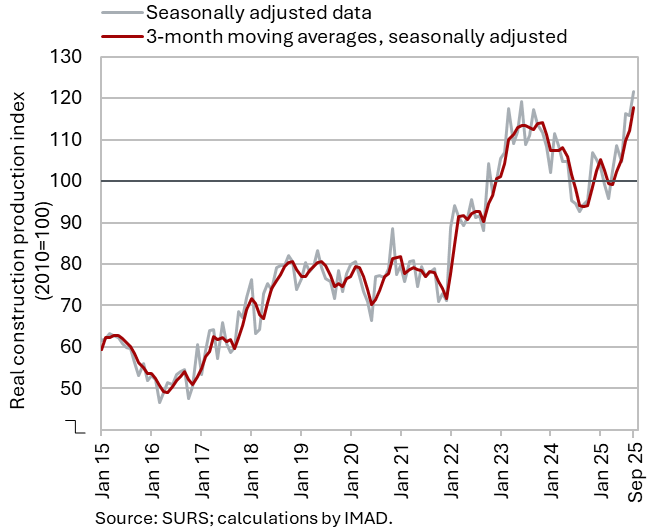
In September, the value of construction works continued to strengthen markedly. Following a decline in the first quarter, construction activity strengthened over the remainder of the year: in the second quarter by 6%, and in the third by as much as 12% (all seasonally adjusted). In the first nine months of the year, the total value of construction put in place was 7% higher than in the same period last year. The largest increase was recorded in the construction of non-residential buildings and specialised construction activities (12%). Activity was also higher in civil engineering (2%), while it was lower in the construction of residential buildings (–2%).
The confidence indicator in construction fell slightly in October, but remains significantly above its long-term average. Companies generally assess new orders as normal. The most important constraint continues to be a shortage of skilled workers, while insufficient demand is cited as a limiting factor by only about one tenth of firms. This indicates that the current challenges in construction are primarily driven by supply-side rather than demand-side constraints.
Turnover in trade, August 2025
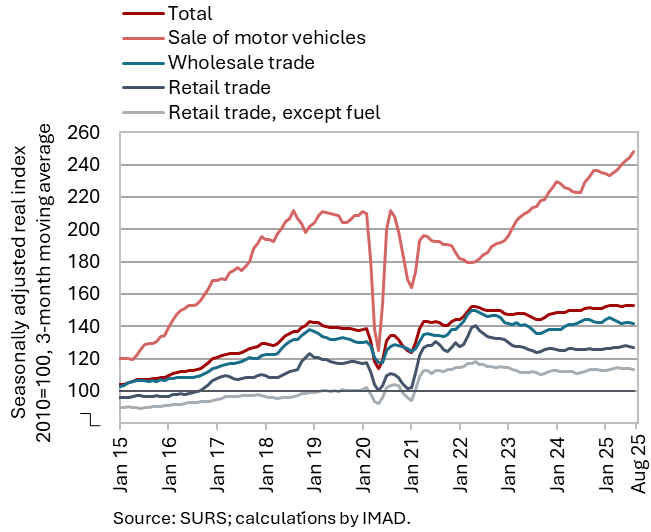
Turnover in trade was, on average, lower in July and August than in the second quarter (seasonally adjusted), except in motor vehicle sales. Turnover in wholesale trade, which had already declined in the second quarter, continued to fall in July and August and was lower year-on-year for the second consecutive period. Turnover in retail trade with food products also fell year-on-year, having decreased on average in July and August after weak growth in the second quarter. Turnover in retail trade with non-food products was, after growth in the first two quarters, slightly lower on average in July and August, but remained higher year-on-year. In the motor vehicles sales, turnover growth persisted through the summer months. Across all trade sectors, sales were higher year-on-year in the first eight months of the year. Growth in motor vehicles sales was robust (7%), while it was modest in other trade sectors (on average below 1%).
Turnover in market services, August 2025

Total real turnover in market services, which had declined in the second quarter and continued to decrease in July, rose sharply in August (by 2.7%, seasonally adjusted), while remaining broadly unchanged year-on-year. Turnover increased significantly in current terms in transportation and storage (particularly in storage) where growth has been sustained over a prolonged period. Growth was also relatively strong in professional and technical activities, following a sharp decline in turnover in the second quarter and in July. In information and communication, modest growth continued in August after an increase in the first half of the year. After an increase in the second quarter and a decline in July, turnover in accommodation and food service activities also rose slightly in August. Turnover decreased only in administrative and support service activities, mainly due to a continued contraction in employment services. In the first eight months of 2025, real turnover was higher year-on-year only in transportation and storage (by 2.3%) and in professional and technical activities (by 0.9%).
Selected indicators of household consumption, Q3 2025

Year-on-year growth in household consumption slowed to 1.0% in the third quarter. In July and August, households purchased significantly more new passenger cars than a year earlier (by 13%), following a year-on-year decline in the first quarter and a 4% increase in the second quarter. Year-on-year turnover growth was also recorded in retail trade with non-food products (up by 1% in real terms), where growth slowed markedly compared with the second quarter, as well as in spending on tourism services abroad (up by 1% in nominal terms). During the summer months, however, households spent less on food and beverages than a year earlier (–2%, after a year-on-year increase in the second quarter), and the number of overnight stays by domestic tourists in Slovenia also decreased (by 2%).
The nominal value of fiscally verified invoices (as a proxy for final sales of goods and services) was 3% higher year-on-year in the third quarter (following year-on-year stagnation in the first quarter and 5% growth in the second).
Economic sentiment, October 2025
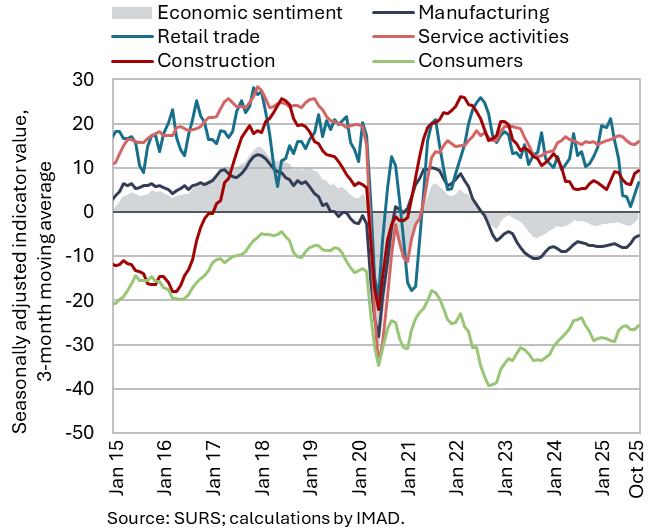
The economic sentiment indicator continued to improve in October and was again also higher year-on-year. Its value has been rising steadily since mid-year, with the confidence strengthening across all activities. Consumer confidence, however, remained roughly unchanged after improving in August. With the exception of manufacturing, where the confidence indicator has been improving only gradually, its value has exceeded the long-term average in all other activities (construction, trade, and services). The consumer confidence indicator remains slightly below its long-term average, showing no notable improvement since mid-year.
Number of persons in employment, September 2025

The number of persons in employment remained similar in September to previous months (seasonally adjusted) and was 0.4% lower year-on-year. The number of employees declined year-on-year (–0.6%), while the number of self-employed increased (1.5%). The largest year-on-year decline in the number of persons in employment was recorded in administrative and support service activities (–4.3%), mainly due to a decrease in employment agencies, followed by manufacturing (–1.7%), and construction (–1.6%). Year-on-year growth in the number of persons in employment continued in public service activities, namely in human health and social work activities (up 3.5%) and in public administration (up 1.5%). The number of foreign citizens in employment increased by 1.7% year-on-year in September, while the number of Slovenian nationals in employment declined by 0.7%.
In the first nine months, the number of persons in employment fell by 0.4% year-on-year.
Number of registered unemployed persons, October 2025

The number of registered unemployed persons continued to increase slightly in October (by 0.2%, seasonally adjusted). According to original data, 45,670 people were unemployed at the end of October, 3.9% more than at the end of September. This largely reflects seasonal trends related to a higher inflow of first-time job seekers into unemployment upon completion of the academic year. Year-on-year, the number of unemployed was 0.5% higher in October, which is largely due to the increased inflow of first-time jobseekers into unemployment since July this year as a result of a higher inflow of foreign nationals with temporary protection status into the unemployment register, and partly also to cyclical developments. The year-on-year declines in long-term unemployment (–6.7%) and in unemployment among persons aged 50 and over (–7.6%) were similar to previous months. Since the end of last year, the number of unemployed young people (aged 15–29) has been above the level recorded a year earlier (in October, it was up 8.3% year-on-year).
Average real gross wage per employee, September 2025

Year-on-year nominal growth in the average gross wage was higher in September (7%) than in the preceding two months. Wage growth in the public sector, which was robust at the beginning of the year, moderated in July and August before strengthening again in September (reaching 9%). The higher growth is largely the result of wage increases in education, which, in our assessment, is related to payments of supplements for teaching and pedagogical obligations. Growth in the private sector also remains relatively strong (5.8%) amid still considerable labour shortages.
In the first nine months, the overall average gross wage increased by 4.5% in real terms (by 6.9% in nominal terms) – by 7.1% in the public sector and by 2.9% in the private sector (by 9.6% and 5.3% in nominal terms respectively).
Consumer prices, October 2025
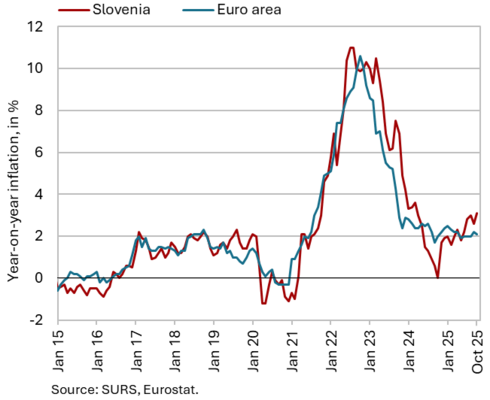
Year-on-year growth in consumer prices increased by 0.5 p.p. to 3.1% in October, with prices remaining unchanged at the monthly level. The higher annual rate was largely attributable to a lower base effect, as a new electricity network charge calculation system was introduced in October last year, starting with the lower summer tariff period. Consequently, price growth in the housing, water, electricity, gas, and other fuels group accelerated from 0.4% to 4.2% in October this year. An additional contributing factor was a 6.3% monthly increase in the price of heat energy. Year-on-year inflation continued to be driven mainly by prices in the food and non-alcoholic beverages group, which increased by 6.8% year-on-year (7.0% in September). The year-on-year growth in prices of durable goods strengthened slightly in October but remained moderate at 0.6%. Due to less pronounced seasonal price increases in the clothing and footwear group, the year-on-year growth in semi-durable goods prices slowed further, reaching 0.2% – the lowest level since September last year. The year-on-year growth in service prices (2.7%) fell below 3% in the last two months.
Slovenian industrial producer prices, October 2025
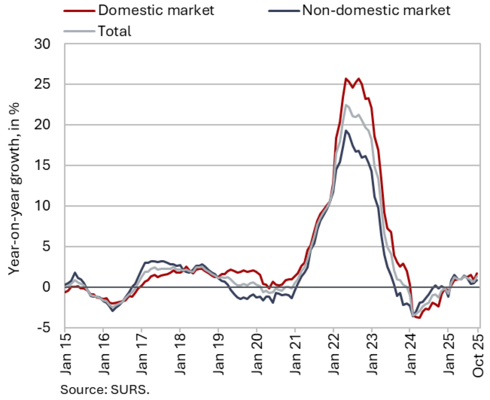
Slovenian industrial producer prices edged up slightly on a monthly basis in October (0.1%), while year-on-year growth almost doubled due to the lower base. Year-on-year price growth on the domestic market (1.7%) was higher than price growth on foreign markets (0.9%). This was mainly the result of modest (0.6%) price growth on euro area markets, while price growth on non-euro area markets is comparable to that on the domestic market. Among main industrial groups, consumer goods continued to record the highest year-on-year growth (3.8%), largely driven by rising prices of non-durable consumer goods (4.4%), within which price growth strengthened in the manufacture of food products (5.5%) and beverages (5.8%). Price growth in the intermediate goods category remained moderate (0.5%), while prices of energy and capital goods were lower year-on-year (by 0.5% and 0.1% respectively).
Loans to domestic non-banking sectors, September 2025

The year-on-year growth in the volume of loans to domestic non-banking sectors slowed by more than one third in September, to 5.5%. This was largely due to the high base from September last year, when the volume of loans to non-financial institutions (NFIs) increased by almost 60% month-on-month. As a result, the year-on-year growth in NFI loans, despite monthly stagnation this September, slowed sharply – from almost 70% to 5.4%. The growth in corporate loans also eased slightly year-on-year, to 2.1%, amid a monthly decline (0.9%). The year-on-year growth in loans to households, which has been gradually strengthening, stood at 7.5%. Growth in housing loans (representing half of households’ new borrowing in the first nine months of this year) stood at 7.4% and was higher than in previous months. The year-on-year growth in consumer loans, which had been gradually moderating in previous months, remained broadly unchanged in September (10.7%). The year-on-year growth in deposits of domestic non-banking sectors (5.6%) has remained relatively stable in recent months. Both household deposits and deposits by non-financial corporations have been growing at similar rates (5.4% and 6.2% respectively). Given the low deposit interest rates, the growth continued to be driven mainly by overnight deposits (7.8%), which account for more than 80% of all deposits by domestic non-banking sectors. The share of non-performing exposures remained unchanged in August, at 1.1%.
Current account of the balance of payments, September 2025

The current account surplus declined year-on-year in the third quarter. This was mainly due to lower goods trade balance. Real exports of goods fell relative to the same period last year, while goods imports increased. The terms of trade improved again. It is estimated that quantity fluctuations contributed EUR 256 million to the year-on-year change in the balance of goods trade in the third quarter (EUR 141 million), while the effect of terms of trade was positive (EUR 115 million). The services surplus increased year-on-year, mainly due to a larger surplus in insurance, travel and transport services. The primary income deficit widened year-on-year mostly due to higher net outflows of dividends and profits from direct investments. The higher secondary income deficit resulted from lower transfers from the EU budget to the government sector. On an annual basis, the current account surplus remained high, with the 12-month current account balance showing a surplus of EUR 3.1 billion in September (4.4% of estimated GDP for 2025).
Revenue (top figure) and expenditure (bottom figure) of the consolidated general government budgetary accounts, September 2025


The consolidated general government deficit in the first nine months of 2025 was EUR 521.3 million higher than in the same period of 2024. It totalled EUR 954.4 million, with the increase reflecting a deceleration in revenue growth, while expenditure continued to expand at a pace similar to last year. Year-on-year revenue growth in the third quarter (8.7%) was considerably higher than in the second (3.7%), driven by an increase in tax revenues, which had declined year-on-year in the second quarter, and by a strengthening of non-tax revenue growth. In the first nine months, revenues rose by 6.2%, compared with 10.9% in the same period last year. This year’s slowdown reflects cyclical factors and last year’s measures that had boosted social-security contributions and certain tax revenues. Expenditure growth slowed slightly in the third quarter (7.4%) compared with the second (9.4%), primarily due to slower growth in wages and other remunerations, as well as a deceleration in allocations to reserves. In the first nine months of this year, expenditure rose by 8.4% year-on-year, similar to the increase recorded in the same period last year (8.6%). The main drivers of expenditure growth in 2025 are employee compensation related to the implementation of the wage reform, pensions, and certain other transfers. The bulk of the consolidated general government deficit stems from the central government budget deficit. In the first nine months of this year, the central government deficit amounted to EUR 952.5 million, while preliminary data indicate that it was somewhat lower in the first ten months (EUR 910 million). By year-end, the deficit is planned to increase. While revenue is projected to strengthen due to the disbursement of funds under the Recovery and Resilience Plan, expenditure growth is expected to intensify due to the second tranche of payments under the public sector pay reform, the payment of the winter holiday allowance, the winter supplement for pensioners and the acceleration of investment spending.
EU budget receipts, October 2025
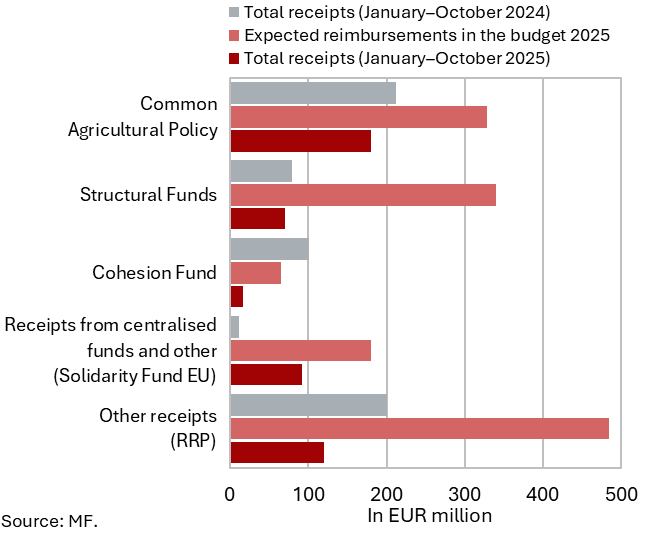
Slovenia’s net budgetary position against the EU budget was negative in the first ten months of 2025 (at EUR 108.9 million). In this period, Slovenia received EUR 480.4 million from the EU budget (34.4% of receipts envisaged in the adopted state budget for 2025) and paid EUR 589.3 million into it (80.6% of planned annual payments). The bulk of receipts were resources from the EU budget for the implementation of the Common Agricultural and Fisheries Policy (37.6% of all reimbursements to the state budget, 55.0% of the planned reimbursements in 2025) and for the Recovery and Resilience Plan (25.0% of all reimbursements to the state budget). Reimbursements from the structural funds amounted to 14.7% of all reimbursements (20.8% of the planned reimbursements in 2025). In October 2025, the European Commission gave a preliminary positive assessment to the fourth request for payment of funds under the RRP. Slovenia is expected to receive payment of the request, amounting to just under EUR 440 million, before the end of this year. According to the Information on the Implementation of the RRP (October 2025), one more payment request is planned to be submitted to the European Commission this year, and two more in 2026 (all three with a total gross value of EUR 772.4 million).