Slovenian Economic Mirror
Slovenian Economic Mirror 4/2026
Economic developments remained relatively favourable at the beginning of the second quarter amid heightened uncertainty. Following stronger growth since the beginning of the year, exports remained broadly unchanged in April and were higher in real terms year-on-year in the first four months of 2026. This growth was driven primarily by exports of pharmaceutical products, vehicles, and electrical machinery and equipment. Similarly, after increasing at the beginning of the year, manufacturing output in April remained at a level comparable to that recorded in March and was higher year-on-year in the first four months across all industry groups by technological intensity. The value of construction put in place has been strengthening since the beginning of the year, driven by civil-engineering construction, and considerably exceeds the level recorded a year earlier. According to the available data for April, household consumption continued to grow, supported by higher purchases of motor vehicles and spending on tourism services both domestically and abroad. The economic sentiment indicator improved in May following a deterioration in April, but remained below its long-term average. The number of unemployed persons continued to decline year-on-year. Wage growth remains relatively high, reflecting the increase in the minimum wage at the beginning of the year and the implementation of the public sector wage reform. Inflation strengthened further in May, mainly owing to higher fuel prices resulting from the conflict in the Middle East and, to a lesser extent, the effect of last year’s low base.
Economic Sentiment Indicator (ESI) in the euro area, May 2026
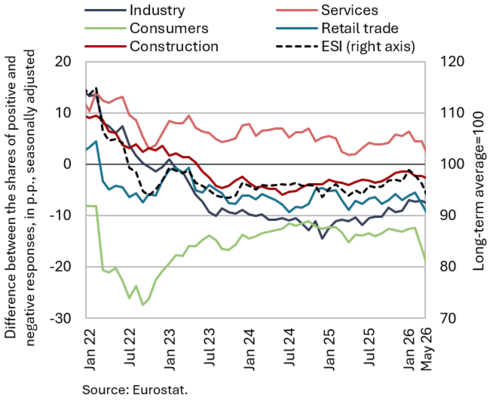
GDP in the euro area declined in the first quarter of this year. According to Eurostat’s latest estimate, following growth of 0.2% in the fourth quarter of last year, GDP declined by 0.2% quarter-on-quarter in the first quarter of this year (seasonally adjusted; by 0.1% in the EU), while year-on-year it was 0.3% higher (the same as in the EU). Its performance was significantly affected by Ireland’s GDP, which fell by 12.1% in the first quarter of this year (and by 16.8% year-on-year). Excluding Ireland’s GDP, quarter-on-quarter growth in the euro area would have been 0.2%. According to sentiment indicators, euro area GDP is expected to decline in the second quarter. In May, the composite Purchasing Managers’ Index (PMI) fell further below 50 (the threshold between expansion and contraction in activity). The manufacturing PMI, which had been gradually improving since the beginning of the year, edged down slightly but continued to signal growth in activity. The services PMI, meanwhile, improved somewhat following a sharp decline in April but remained below 50. The Economic Sentiment Indicator (ESI) remained unchanged from the previous month in May but was lower year-on-year. On a monthly basis, sentiment deteriorated mainly in retail trade and construction, while, following a pronounced decline in April, it improved somewhat among consumers and in services. Despite the marked deterioration in consumer sentiment, the European Commission expects private consumption to remain the main driver of growth in the euro area. Following GDP growth of 1.4% in 2025, the Commission forecasts euro area GDP growth of 0.9% in 2026, before strengthening to 1.2% in 2027. In its previous forecast, published in November, the European Commission had projected growth of 1.2% and 1.4% for the euro area. The ECB also revised down its growth forecast for the euro area in June. It now expects growth of 0.8% this year (0.9% in March) and 1.2% next year (1.3% in March).
OECD Economic Outlook (time-limited disruption scenario), June 2026
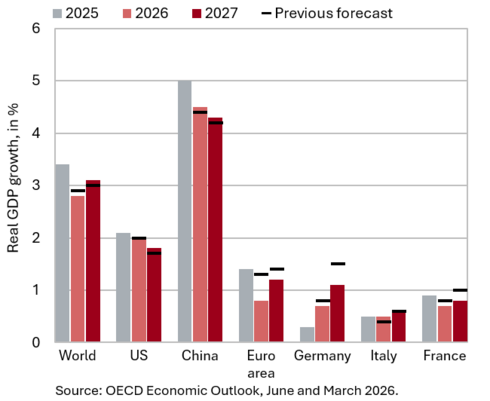
Given the uncertainty surrounding the conflict in the Middle East, the OECD prepared two scenarios in its June forecast, both of which project lower global economic growth this year than last year. In the time-limited disruption scenario, which assumes relatively short-lived disruptions, global economic growth is projected to slow to 2.8% this year (3.4% last year) before picking up to 3.1% next year. In the United States, economic growth is projected to ease to 2.0% in 2026 and 1.8% in 2027, while in China it is projected to moderate to 4.5% in 2026 and 4.3% in 2027. Growth in the euro area is projected at 0.8% this year, almost half the rate recorded last year, before strengthening to 1.2% next year. In the prolonged disruption scenario, in which broader disruptions persist until the second half of 2027, global growth would decline to 2.1% this year and further to 1.8% in 2027. Higher energy prices, supply shortages, tighter financial conditions and weaker confidence would weigh on economic activity worldwide, with energy-importing Asian economies particularly exposed. Both scenarios are based on the assumption that economic activity will be supported by strong AI-related investment, production and trade, lower US tariffs than initially announced and supportive financial and fiscal conditions. The OECD identifies further disruptions to energy supply, lower AI investment, export restrictions for key products in short supply and a reassessment of risks in financial markets as key downside risks. On the other hand, greater business resilience and stronger positive effects of artificial intelligence on productivity could contribute to higher growth.
Commodity prices, May 2026
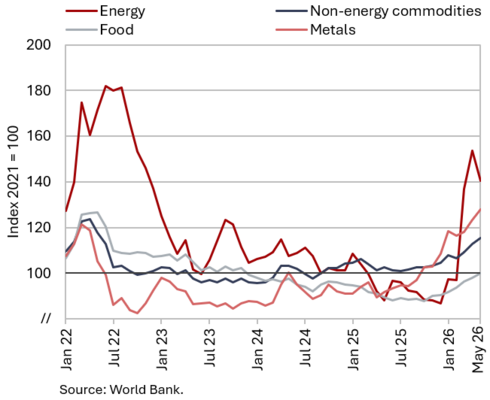
Brent crude oil prices declined in May, while the average price of natural gas on the European market and the average price of non-energy commodities increased. The average dollar price of Brent crude oil fell by 8.6% to USD 107.7 in May and the euro price by 8.4% to EUR 92.2. Compared with May last year, oil prices were 67.5% higher in US dollar terms and 61.7% higher in euro terms. The monthly decline in oil prices was driven mainly by expectations of progress in peace negotiations between the United States and Iran. By the end of May, the Brent crude oil price had fallen to around USD 90 per barrel, which was nevertheless still around 30% above its level prior to the outbreak of the conflict. The average euro price of natural gas on the European market (Dutch TTF) edged up by 4.7% to EUR 47.3/MWh in May. Year-on-year, natural gas prices were 34.5% higher. The increase in gas prices was mainly associated with reduced supply, lower electricity generation from renewable energy sources and the resulting greater need for gas-fired power generation, as well as low levels of gas storage inventories in Europe. According to the World Bank, the average dollar price of non-energy commodities rose by 2.5% month-on-month in May and by 12.7% year-on-year. On a monthly basis, cocoa and tea prices recorded the largest increase (5.4%), while on an annual basis the strongest increases were observed in fertiliser prices (49.9%) and metal prices (43.0%).
Short-term indicators of economic activity in Slovenia, March–April 2026
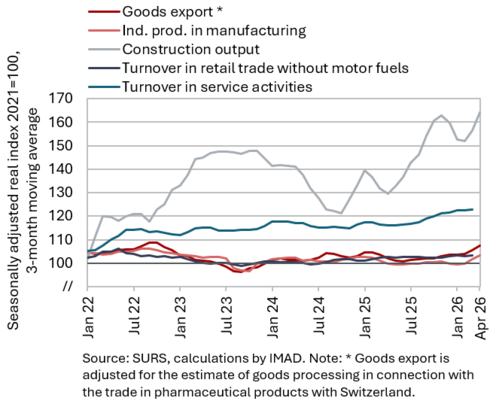
Short-term indicators of economic activity in Slovenia suggest that economic developments at the beginning of the second quarter remained relatively favourable despite heightened uncertainty. Following stronger growth at the beginning of the year, exports remained broadly unchanged in April and were 2.8% higher in real terms year-on-year in the first four months of the year (imports increased by 5.7%). The largest contributions came from exports of pharmaceutical products, motor vehicles, and electrical machinery and equipment (on the import side, machinery and equipment, motor vehicles, and metals and metal products made the largest contributions). Similarly, after increasing at the beginning of the year, manufacturing output remained at its March level in April. In the first four months of the year, it was higher year-on-year (by 1.7%), with growth recorded across all technology-intensity groups. The value of construction put in place has been strengthening since the beginning of the year, driven by civil-engineering construction, and is now considerably higher than a year earlier. Available data for April point to continued growth in household consumption, supported by higher purchases of motor vehicles and increased spending on tourism services both domestically and abroad. Data on the value of fiscally verified invoices for May also indicate continued growth of consumer spending. The economic sentiment indicator deteriorated following the outbreak of the conflict in the Middle East. In May, however, it improved and returned to a level similar to that recorded a year earlier, although it remained below its long-term average.
Trade in goods – in real terms, April 2026
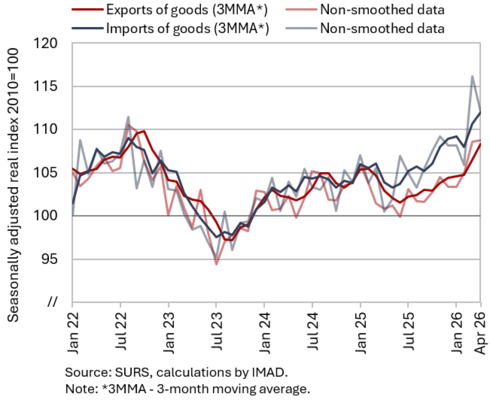
Goods exports remained broadly unchanged in April compared with March, while imports declined; nevertheless, both were higher than a year earlier. Real exports of goods remained broadly unchanged month-on-month in April (+0.2%), following growth in the preceding months. Exports of machinery and equipment (including vehicles) and of metals and metal products increased, while exports of chemical products and pharmaceuticals also rose, albeit to a lesser extent. By contrast, exports of materials (excluding metals and metal products) and primary products declined. Month-on-month, exports increased to Italy and several non-EU countries (the United States, the United Kingdom and Switzerland), while exports to Germany, Austria and France decreased. Real imports of goods fluctuated markedly in recent months. Following strong growth in March, they declined significantly in April (–3.5%), although they remained above the level recorded at the beginning of the year. Import developments over the past two months were driven mainly by larger fluctuations in imports of consumer goods, while imports of intermediate goods continued to increase (all seasonally adjusted). Compared with the same period last year, real exports were 2.8% higher and real imports 5.7% higher in the first four months of the year, with one additional working day compared with the same period a year earlier. The year-on-year increase in exports in the first four months was driven primarily by exports of pharmaceutical products, motor vehicles, and electrical machinery and equipment, while import growth was mainly attributable to the machinery and equipment group as a whole (including motor vehicles), as well as metals and metal products.
Amid uncertain international economic conditions, export orders improved slightly in May but remained relatively low.
Trade in services – in real terms, April 2026
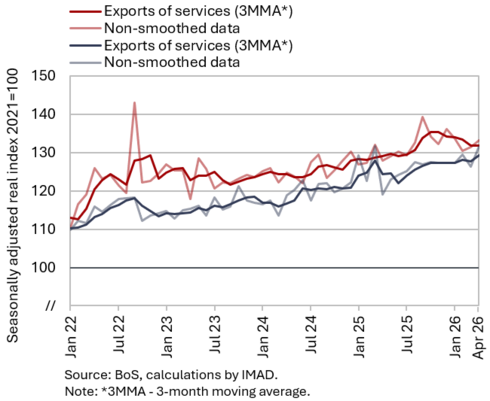
Real exports and imports of services increased in April, both month-on-month and year-on-year. On the export side, growth was driven mainly by exports of transport and ICT services, both of which approached their highest levels in recent years. After several months of growth, exports of tourism-related services declined slightly, although they remained relatively high. Exports of other business services also decreased somewhat. On the import side, imports of services increased markedly in April following a decline in the previous month, driven primarily by higher imports of other business services and ICT services (all seasonally adjusted). In the first four months of the year, exports and imports of services were higher than in the same period last year (both by 2.2%). Year-on-year growth in both exports and imports was driven primarily by increased trade in tourism-related services, particularly with Austria and Croatia. Exports of insurance services (to Italy) were also significantly higher than a year earlier, having increased sharply in the second half of last year. Among the main service categories, exports of transport services and both exports and imports of other business services were also higher.
Production volume in manufacturing, April 2026
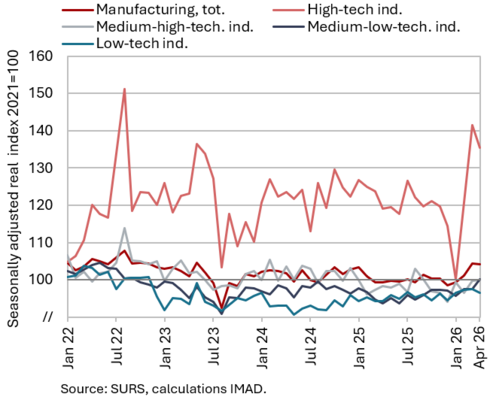
Manufacturing output, which had strengthened at the beginning of the year, remained close to the previous month's level in April (seasonally adjusted). In April, only medium-low-technology industries recorded a slight increase in output, while output in the other technology groups either declined slightly or remained close to the previous month's level (seasonally adjusted). In the first four months of the year, manufacturing output was 1.7% higher year-on-year (working-day adjusted), with growth recorded across all groups of industries by technological intensity. In addition to low-technology food manufacturing, the overall year-on-year increase was driven mainly by more technologically intensive industries, particularly the manufacture of machinery and equipment n.e.c. and the manufacture of ICT equipment. Output also increased in the repair and installation of machinery and equipment and, after contracting over the previous four years, in the manufacture of motor vehicles, trailers and semi-trailers (by 3.3%). By contrast, output in energy-intensive industries was lower than a year earlier. In 2025, these industries generally recorded activity levels similar to those of the previous year (with the exception of the manufacture of basic metals, where output declined). According to our estimates, output in the pharmaceutical industry also remained lower than a year earlier.
Activity in construction, April 2026
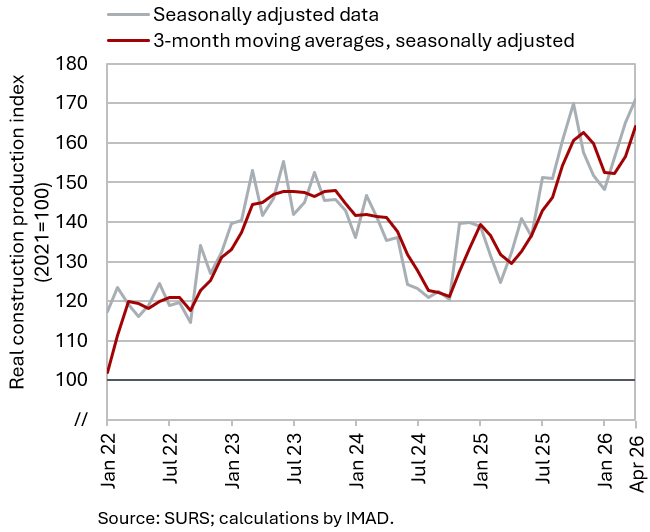
In April, the value of construction work put in place increased (seasonally adjusted) and was also significantly higher than a year earlier (32%). After declining at the beginning of 2025, construction activity gradually strengthened thereafter, reaching its highest level in October. It then declined until January this year before picking up again (seasonally adjusted). This dynamic was primarily driven by developments in civil engineering works.
However, some other data suggest weaker growth in construction activity. According to VAT data, activity in the first four months was 13% higher than in the same period last year, which is 12 p.p. lower than indicated by the data on the value of construction work put in place. Similarly, data on output in the manufacture of non-metallic mineral products, which is traditionally closely linked to construction activity, do not indicate such strong growth, with production declining by 1% year-on-year in the first four months.
Value of fiscally verified invoices, May 2026
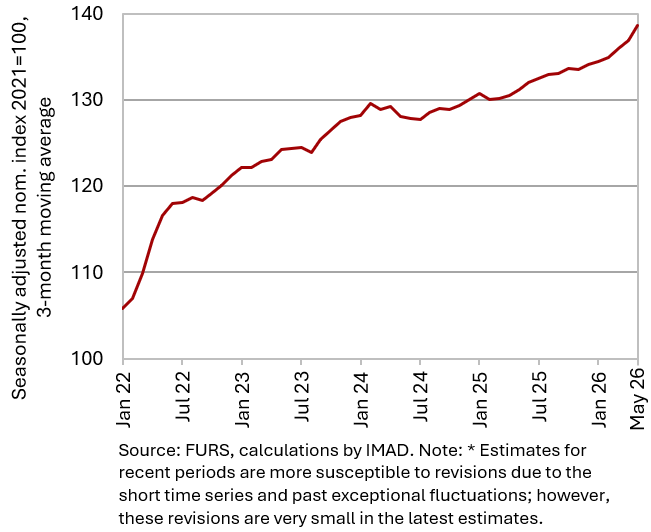
The nominal value of fiscally verified invoices continued to increase month-on-month in May, while year-on-year growth doubled to 6%. Compared with April, year-on year growth in sales in the trade sector strengthened markedly (from 3% to 6%). This sector accounted for almost three-quarters of the total value of fiscally verified invoices issued. The acceleration was driven primarily by stronger growth in retail sales, which doubled to 8%. Following a decline in April, wholesale trade sales were also slightly higher year-on-year in May. Among the more important trade activities, growth strengthened particularly in the sales of motor vehicles, motorcycles and related parts and accessories; clothing, footwear, pharmaceutical and medical products; and motor fuels. The latter was, however, significantly affected by the high year-on-year increase in petroleum product prices. Growth also accelerated in accommodation and food service activities (to 11%), which accounted for more than 10% of the total value of fiscally verified invoices, and in cultural, sports, recreational and other service activities (to 9%). Year-on-year growth in the nominal value of fiscally verified invoices was also higher in May than in the first quarter (5%).
Turnover in trade, March 2026
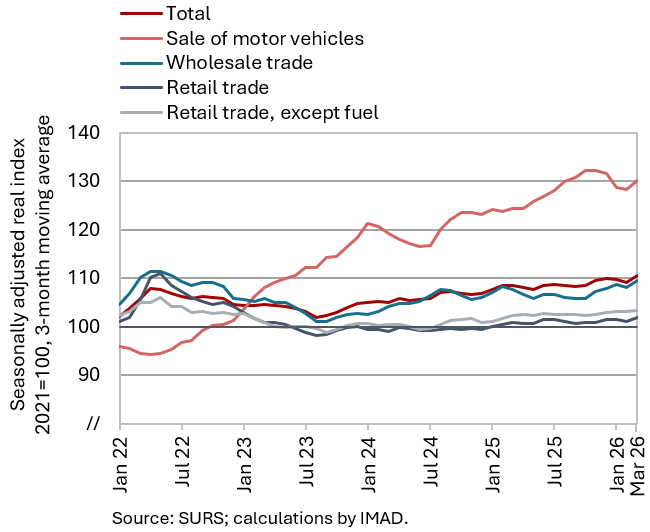
Driven by strong sales growth in March, real turnover across most trade sectors in the first quarter exceeded its level a year earlier. Following declines in the previous three months, turnover in wholesale trade increased markedly in March, while turnover in the sale of motor vehicles rose for the second consecutive month. After declining at the beginning of the year, following relatively strong growth in December, sales in retail trade of food, beverages and tobacco products and in retail trade of non-food products also increased in March (all seasonally adjusted). Compared with the first quarter last year, sales increased across all trade sectors except retail trade in food, beverages and tobacco products. Year-on-year growth reached 5% in the sale of motor vehicles, while wholesale trade and retail trade of non-food products each recorded growth of 3%.
Turnover in market services, March 2026
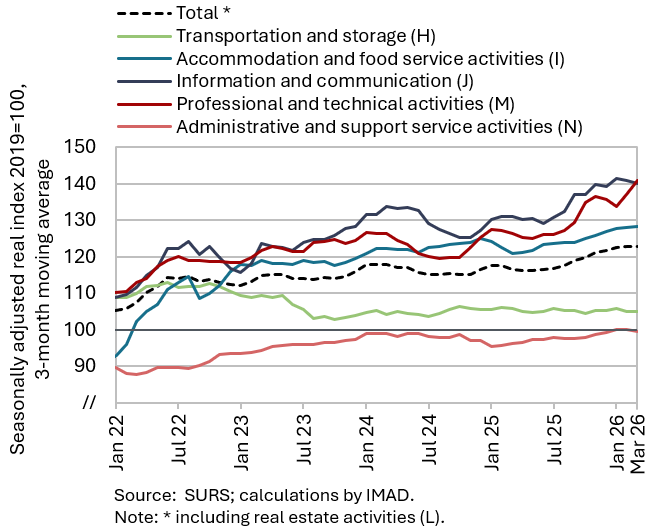
Total real turnover in market services continued to rise in the first quarter (seasonally adjusted) and was also higher year-on-year. Turnover in information and communication has been strengthening since the second half of last year. Growth slowed somewhat in the first quarter due to a decline in turnover in telecommunications activities. Following strong growth in the fourth quarter of last year, growth also moderated in professional and technical activities and accommodation and food service activities, although turnover in both sectors has been increasing since the second half of last year. In transportation and storage, turnover declined slightly in the first quarter but has broadly stagnated since the end of 2024. In administrative and support service activities, turnover has been gradually increasing since the beginning of last year. Growth moderated in the first quarter, and turnover remained slightly below its comparable 2019 level (all seasonally adjusted). Total real turnover was 5.5% higher year-on-year in the first quarter; only in transportation was it slightly lower than a year earlier (by 0.6%).
Selected indicators of household consumption, Q2 2026
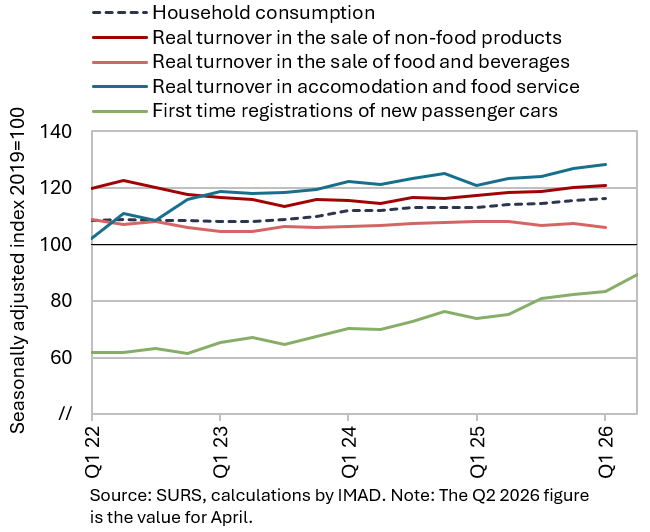
Available data point to continued year-on-year growth in household consumption at the beginning of the second quarter. In April, following relatively strong year-on-year growth in the first quarter, households continued to spend more than a year earlier on purchases of new passenger cars. Year-on-year, spending on tourism services increased both abroad (by 10% in nominal terms, while the number of overnight stays by Slovenian residents in Croatia rose by more than one third) and domestically (with the number of domestic overnight stays in Slovenia increasing by 8%). Continued year-on-year growth in household consumption in the second quarter is also indicated by the growth in the nominal value of fiscally verified invoices (used as a proxy for final sales of goods and services), which, despite somewhat higher inflation, was broadly similar in April and May combined (5%) to that recorded in the first quarter.
Electricity consumption by consumption group, May 2026
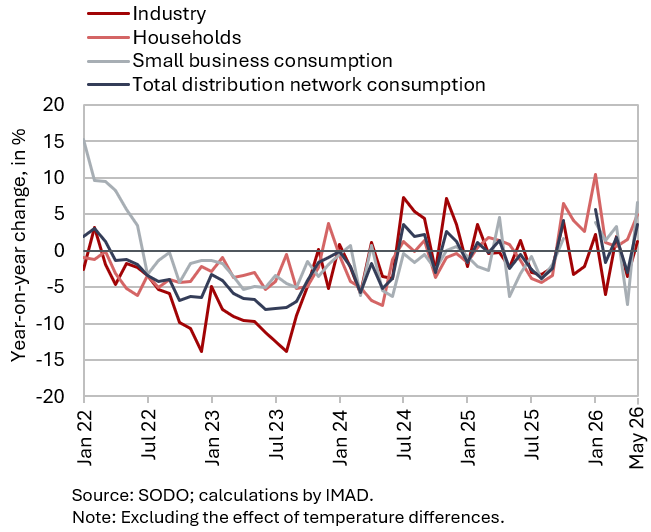
Electricity consumption in the distribution network was 3.6% higher year-on-year in May. Industrial consumption and consumption by other business consumers – both of which may serve as indicators of economic activity – were, with the same number of working days, 1.2% and 6.6% higher year-on-year, respectively, while household consumption increased by 5.0%.
Economic sentiment, May 2026
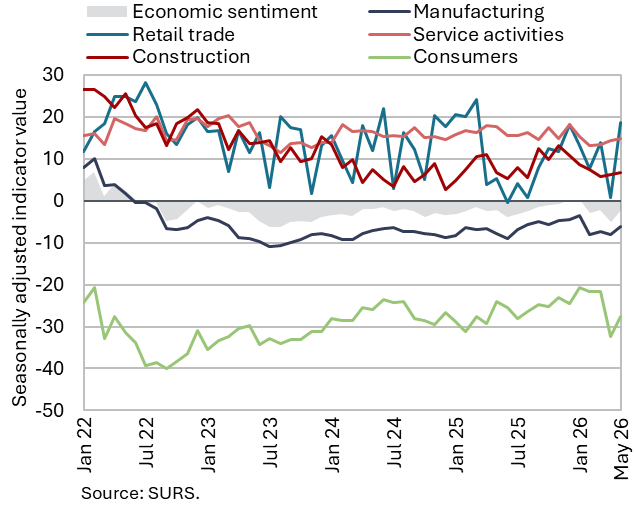
Despite improving in May, the economic sentiment indicator remained slightly below its long-term average. Confidence improved across all sectors, with the strongest increases recorded in trade (where monthly fluctuations tend to be pronounced) and among consumers. Compared with May last year, the overall sentiment indicator remained broadly unchanged, while confidence declined in services and among consumers. The economic sentiment indicator was slightly below its long-term average, as were the confidence indicators in manufacturing and among consumers, whereas the indicators for retail trade, services and construction remained above their long-term averages.
Number of persons in employment, April 2026
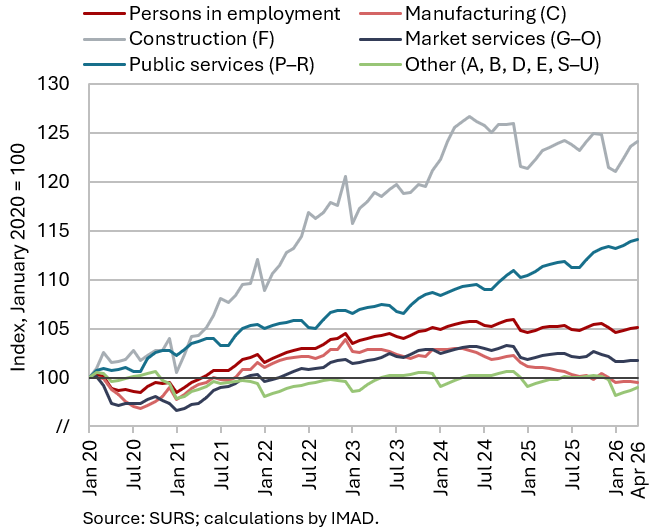
According to the Statistical Register of Employment (SRDAP), the number of persons in employment in April remained broadly unchanged relative to previous months (seasonally adjusted) and compared with a year earlier. The number of employees declined slightly year-on-year (–0.2%), while the number of self-employed increased (0.8%). Despite the relatively stable overall number of persons in employment, considerable differences in year-on-year changes across activities persist. The largest year-on-year declines in the number of persons in employment were recorded in trade (–1.5%), manufacturing (–1.4%) and administrative and support service activities (–1.4%), while employment was higher in public service activities overall (2.3%), particularly in health and social work (3.7%). The number of foreign citizens in employment increased by 2.7% year-on-year in April, while the number of Slovenian nationals in employment declined by 0.5%, primarily due to retirements.
Number of registered unemployed, May 2026
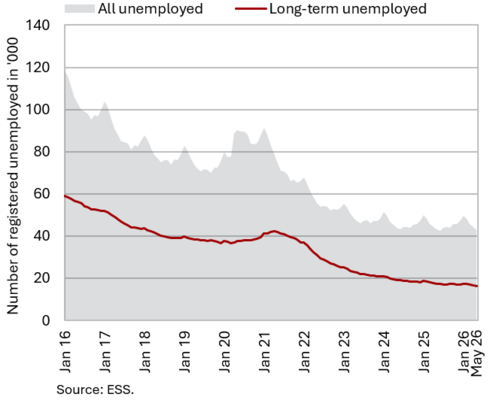
The number of registered unemployed fell slightly month-on-month in May (-0.2%, seasonally adjusted) and was also slightly lower year-on-year (-0.3%). According to original data, 43,060 people were unemployed at the end of May, 2.5% fewer than at the end of April. The year-on-year decline in the number of long-term unemployed and unemployed persons aged over 50 continued (down 5.9% and 3.5% respectively). The number of unemployed young people (aged 15–29), which has been higher year-on-year since October 2024, exceeded its level from a year earlier by 4.1% in May, reaching 8,972 persons. This may be at least partly related to the increase in the size of cohorts entering the labour market (between 2023 and 2025, the number of residents aged 15–29 increased by ten thousand or 3.3%), while demand for labour has weakened. In the first five months of the year, the number of unemployed persons was 0.4% lower year-on-year.
Average real gross wage per employee, March 2026
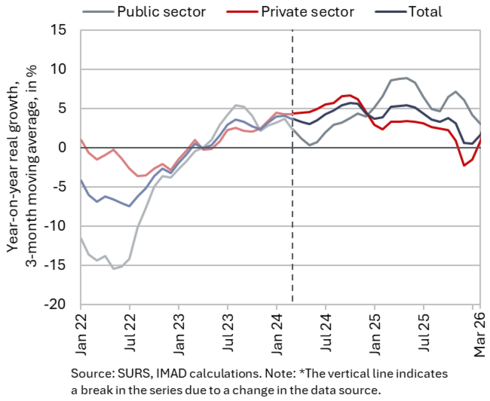
Year-on-year nominal growth in the average gross wage remained relatively high in March (7.3%), with growth similarly high in both the private (7.4%) and public sectors (6.8%). Growth in the private sector was primarily influenced by an increase in the minimum wage at the beginning of the year (+16%). The highest year-on-year wage growth in March was recorded in construction, accommodation and food service activities, and administrative and support service activities (including employment agencies), which are activities with the highest shares of minimum wage recipients. In the public sector, strong wage growth was related to last year’s wage reform and agreements reached under collective bargaining agreements. In the first three months of this year, the overall average gross wage increased by 4.2% in real terms (7.1% in nominal terms) – by 3.3% in the public sector (6.1% in nominal terms) and by 4.6% in the private sector (7.4% in nominal terms).
Active and inactive population, Q1 2026
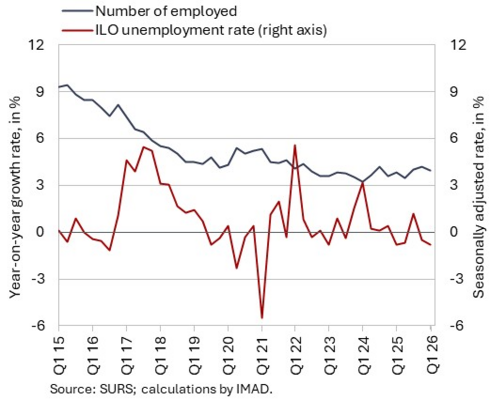
According to survey data, the number of unemployed persons increased year-on-year in the first quarter of this year, while the number of persons in employment declined. According to survey data, the number of unemployed persons reached 43,000, up 4.9% on the first quarter of 2025. This increase was driven primarily by a decline in employment in manufacturing. The survey unemployment rate (4.1%) was also slightly higher year-on-year (by 0.1 p.p.).
In the first quarter of this year, the number of persons in employment was lower year-on-year (–0.8%), reflecting declines in the numbers of employees in paid employment, self-employed persons and unpaid family workers, while the number of student workers increased.
Consumer prices, May 2026
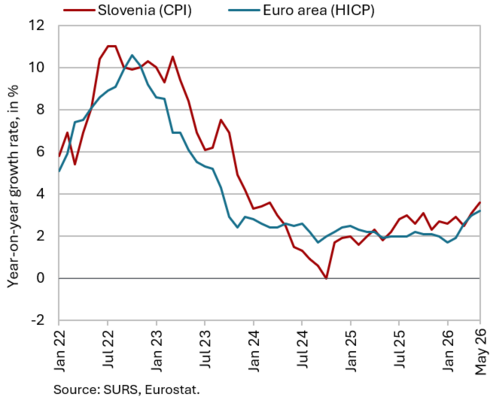
Consumer price inflation increased for the second consecutive month in May (to 3.6%, up from 3.1% in April), while prices rose by 0.5% month-on-month. Housing, water, electricity, gas and other fuels continued to make the largest contribution (1.3 p.p.) to year-on-year inflation in May, with prices in this category being 10% higher than a year earlier. This primarily reflected higher energy prices owing to a lower base effect stemming from earlier electricity price regulation measures, the persistently strong growth in solid fuel prices since the beginning of the year, and the impact of the conflict in the Middle East on crude oil and petroleum product prices (liquid fuels – heating oil). Through higher fuel prices, which were around one-fifth above their level a year earlier, the conflict also contributed significantly to inflation in the transport category (0.8 p.p.). Price growth in the food and non-alcoholic beverages group continued to moderate gradually (0.9%). Prices of semi-durable goods (0.1%) and durable goods (-0.2%) remained broadly unchanged year-on-year. Annual services inflation (3.8%) strengthened by 0.2 p.p. compared with April.
Slovenian industrial producer prices, April 2026
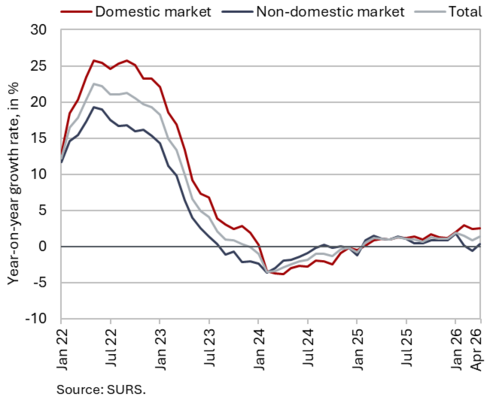
Slovenian industrial producer prices rose sharply in April. Prices increased by 0.5% month-on-month (the largest increase in the last 12 months), while year-on-year growth strengthened by 0.5 p.p. to 1.4%. Year-on-year growth was driven mainly by higher intermediate goods prices (up 1.8%), with consumer goods prices also making a significant contribution (up 1.4%). Although growth in non-durable consumer goods prices (0.4%) slowed in recent months, growth in durable consumer goods prices accelerated (to 5.3%), in our assessment mainly due to higher furniture prices (7.3%). Prices of capital goods increased by 1.1% year-on-year, while energy prices remained lower (–0.8%). The divergence between price growth on the domestic and foreign markets narrowed slightly: in April, year-on-year growth in industrial producer prices on the domestic market (2.5%) remained close to the levels recorded in previous months, while prices on foreign markets (following a decline in March) were again slightly higher year-on-year (by 0.3%).
Loans to domestic non-banking sectors, April 2026
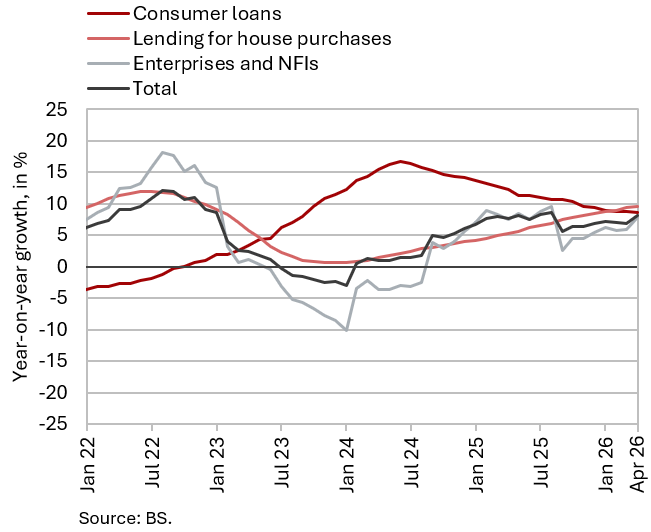
Year-on-year growth in the volume of loans to domestic non-banking sectors increased to 8.2% in April. On a monthly basis, credit growth reached 1.6%, the highest rate since September 2024. Growth in lending to all non-bank sectors (corporations and NFIs, households and government) strengthened, which in our assessment may have been related to expectations of a tightening of still relatively favourable borrowing conditions. The largest contribution to year-on-year growth continued to come from household lending, which was 8.3% higher than a year earlier. Growth in housing loans strengthened further (9.6%), while growth in consumer loans, although still relatively high (8.7%), continued to moderate gradually. Following a strong acceleration in April (1.8%), year-on-year growth in lending to corporations and NFIs increased by around one-third (to 7.8%). Year-on-year growth in deposits of non-banking sectors remained broadly unchanged (6.7%). The share of non-performing exposures in the banking system (March data) has remained at 1.6% since the end of last year.
Current account of the balance of payments, April 2026
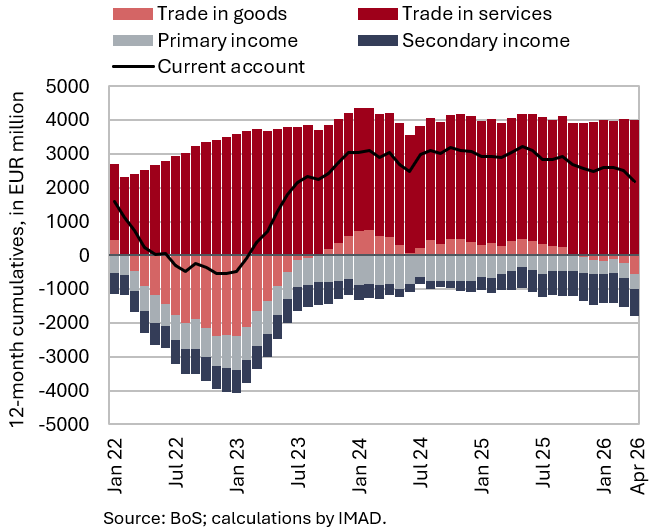
The 12-month current account surplus decreased by EUR 843,7 million compared to the previous 12-month period, reaching EUR 2.2 billion (3.0% of estimated GDP). This decline was driven by developments in the goods balance and the secondary income balance. The goods balance shifted into deficit as import growth outpaced the modest increase in exports. The year-on-year increase in import prices in April (4.1%) has not yet been reflected at the annual level, as import prices had been declining continuously from May 2023 to March 2026. At the annual level, real exports rose by 0.3%, while real imports increased by 4.2%. In nominal terms, exports rose by 1.0% and imports by 3.3%. The secondary income deficit widened primarily due to higher net contributions by the general government sector to the EU budget. The services surplus increased, most notably in insurance services, reflecting the expansion of a Slovenian insurance company’s operations in the Italian motor insurance market. A higher surplus was also recorded in transport services and travel. The primary income deficit narrowed mainly as a result of higher compensation of Slovenian employees working abroad.
Revenue (top figure) and expenditure (bottom figure) of the consolidated general government budgetary accounts, April 2026
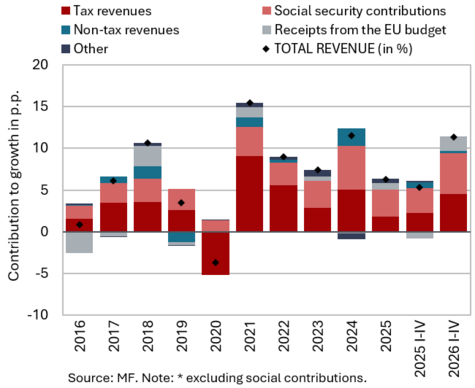
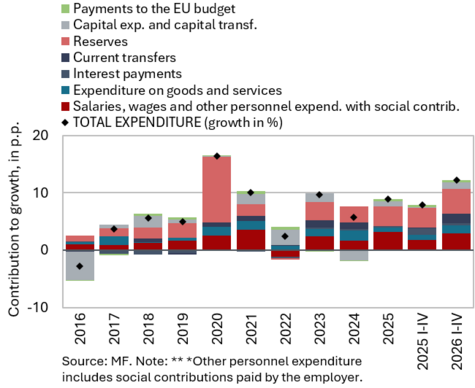
In the first four months of this year, the deficit of the consolidated balance of public finances was higher year-on-year. It totalled EUR 397.5 million compared to EUR 286 million in the same period last year. Revenue increased by approximately 11.4% in the first four months of the year, representing stronger growth than in the same period last year (5.3%). Revenue growth was driven primarily by higher social security contributions (mainly long-term care contribution introduced in July last year), tax revenues and receipts from EU funds. As a result of the settlement of tax liabilities in April, corporate income tax revenue increased markedly year-on-year. Excise duty revenue also rose slightly, having been lower year-on-year in the first three months of the year. Growth in value added tax (VAT) revenue was also considerably stronger than a year earlier. Receipts from EU funds increased in the first four months, mainly reflecting the implementation of projects under the Recovery and Resilience Plan. Expenditure was 12.2% higher year-on-year in the first four months, exceeding the increase recorded in the same period last year (7.9%). The increase in expenditure was driven mainly by higher compensation of employees due to the implementation of the wage reform and by transfers. The increase in transfers to individuals and households was mainly driven by higher expenditure on pensions, unemployment benefits, which were raised at the beginning of this year, and personal assistance. Transfers for the provision of public passenger transport services under newly awarded concession contracts also increased, as did transfers to war-disabled persons, war veterans and victims of war violence. Expenditure on goods and services (particularly expenditure on the current maintenance of business premises) was also higher year-on-year, as was capital expenditure, especially related to new construction, reconstruction and renovation projects.
EU budget receipts, April 2026
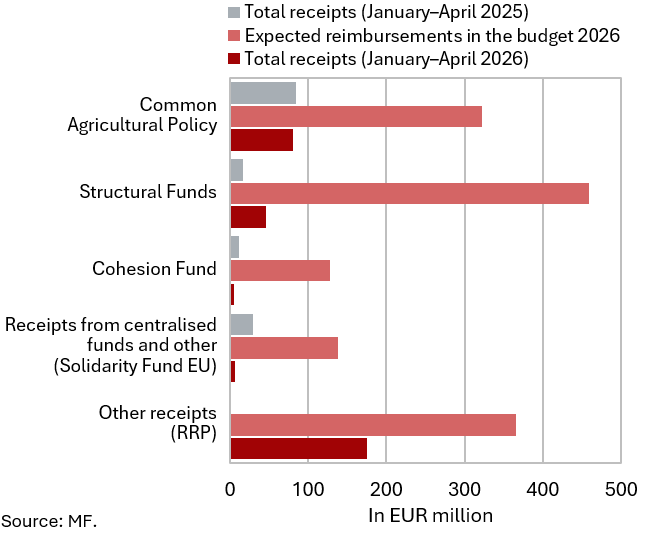
Slovenia’s net budgetary position against the EU budget was positive in the first four months of 2026 (at EUR 47.7 million). During this period, Slovenia received EUR 312.6 million from the EU budget, i.e. EUR 170.8 million more than in the same period last year. Over the same period, it contributed EUR 264.9 million to the EU budget, which was EUR 37.9 million more than in the same period last year, when the state budget recorded a negative net position vis-à-vis the EU budget of EUR 85.1 million. The increase in receipts was mainly related to the implementation of the Recovery and Resilience Plan (RRP) (EUR 175.3 million), the Common Agricultural and Fisheries Policy (EUR 80 million) and Structural Funds projects (EUR 45.8 million). A more pronounced increase in RRP-related receipts was recorded in April, following the booking of EUR 100 million out of the approximately EUR 230 million that Slovenia received from the EU budget in April on the basis of the fifth payment request submitted in December last year. In March 2026, Slovenia also submitted its sixth (penultimate) payment request, with the maximum possible net disbursement amounting to around EUR 41 million. According to the Information on the Implementation of the Recovery and Resilience Plan (May 2026), by April approximately one-quarter of the estimated expenditure planned for 2026 had been realised, while since the start of implementation 71% of the available RRP funds had been disbursed.