Slovenian Economic Mirror
Related Files:
Slovenian Economic Mirror 3/2024
Economic activity in the euro picked up slightly in the first quarter, as expected by international institutions. The outlook for the second quarter remains strong. In April, the Purchasing Managers’ Index for the euro area climbed above the 50 mark (the threshold between economic expansion and contraction) for the first time in ten months; economic sentiment (ESI) and confidence in all activities and among consumers were higher in April than in the second half of last year. Organisation for Economic Co-operation and Development (OECD) revised its growth forecasts for this year and next upwards. In Slovenia, real gross domestic product (GDP) stagnated month-on-month in the first quarter of this year, following growth of around 1% in the previous quarter, while it rose by 2.1% year-on-year. Investment activity, which experienced significant growth in the previous year, has weakened, along with growth in construction activity. Exports of goods and value added in manufacturing increased for the second consecutive quarter and was also higher year-on-year. In April, year-on-year inflation fell to 3%, the lowest level since October 2021, being still main driven by prices of services. In the Selected topic, we focused on the performance of companies in 2023. As noted, among other things, the performance indicators have returned to 2021 levels. Last year, all sectors operated with profit, but the primary driver of the overall profit increase was the strong improvement in the business results in electricity, gas, steam and air conditioning supply, namely in the energy sector. In manufacturing, net profit fell markedly in energy intensive manufacturing activities, although it was still above the highest levels achieved before the epidemic.
Related Files:
- International environment
- Economic trends
- Labour market
- Prices
- Financial markets
- Balance of payments
- Public finance
Economic growth in Slovenia’s main trading partners, Q1 2024

After contracting in the second half of last year, economic activity in the euro area picked up in the first quarter, and available indicators suggest that growth will continue into the second. After a quarter-on-quarter contraction in the second half of last year (of 0.1% in Q3 and Q4) due to tighter financing conditions, weak confidence and a loss of competitiveness, euro area GDP grew by 0.3% in Q1 (by 0.4% year-on-year). On average, the EU recorded quarter-on-quarter growth of 0.3%, while year-on-year growth was 0.4%. Most international institutions (the EC, ECB, IMF and OECD) expected GDP growth in the euro area and the EU in the first quarter, according to their latest forecasts. All main Slovenian economic partners have experienced modest quarter-on-quarter economic growth. Italy’s GDP grew by 0.3% compared to the previous quarter, while Germany, France and Austria saw growth of 0.2%. According to available indicators, economic growth in the euro area is expected to continue in the second quarter. The composite PMI continued to rise in April, reaching its highest level in 11 months (51.7). This increase was driven by activity in the services sector, while manufacturing output continues to be held back by weak demand. In April, Germany’s composite PMI climbed above the 50 mark (the threshold between economic expansion and contraction) for the first time in ten months. The economic sentiment indicator (ESI) in the euro area and confidence in all activities and among consumers were at a similar level in April as in the first quarter and higher than in the second half of last year.
OECD economic outlook, May 2024
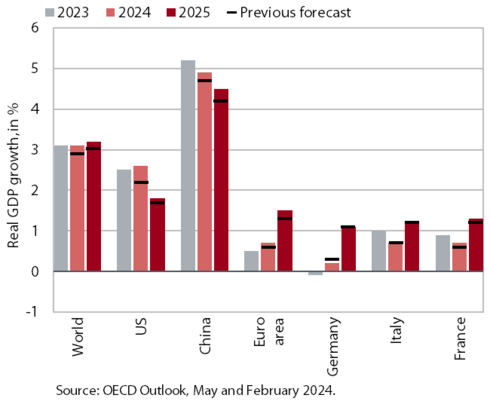
In May, the OECD revised its growth forecasts for the world’s major economies upward. Global GDP growth is expected to be slightly higher than projected at the beginning of the year, driven by more significant reductions in inflation than anticipated. This year, global GDP is forecast to remain unchanged from last year (3.1% ), before edging up slightly in 2025 (to 3.2%). GDP in the USA is projected to grow by 2.6% this year, moderating to 1.8% in 2025 amid high borrowing costs and lower domestic demand. In China, economic growth is expected to ease to 4.9% this year and 4.5% next year amid ongoing problems in the real estate sector. The euro area’s GDP growth is projected to gradually strengthen this year, mainly driven by increased private consumption supported by higher confidence, low unemployment and wage growth and a further decline in inflation. The OECD forecasts growth of 0.7% in the euro area in 2024 and 1.5% in 2025. However, the outlook is surrounded by high uncertainty related to a potential further escalation of the situation in the Middle East, which could weigh on the global and euro area economies, particularly through higher energy prices, elevated uncertainty and tightening in financial markets.
Commodity prices, April 2024
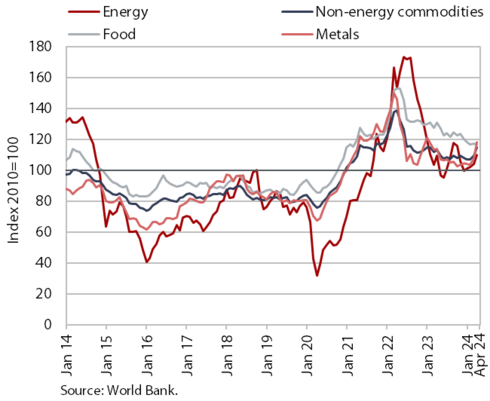
Prices of Brent crude oil and non-energy commodities continued to rise in April. After increasing gradually since the beginning of the year, the average dollar price of Brent crude oil reached USD 89.8 in April (up by 5.1% month-on-month), while the average euro price was EUR 83.67 (up by 6.5% month-on-month). The surge in oil prices was primarily driven by escalating conflicts in the Middle East. Compared to last April, the dollar price of Brent oil increased by 5.9% and the euro price rose by 8.3%. The euro prices of natural gas on the European market (Dutch TTF) were significantly lower in April compared to a year ago, by 31.3%. According to the World Bank, the average dollar price of non-energy commodities rose month-on-month for the second month in a row in April (by 5.3%). Among the main commodity groups, prices of metals and minerals in particular saw a notable increase (up by 8.9%). After nearly two years of decline, prices of non-energy commodities were higher also year-on-year in April (by 1.4%). Commodity prices, which were 30% higher in April than in the same period before the epidemic, are being driven up in particular by geopolitical tensions, investments related to the green transition, and investments in infrastructure and production capacity in China.
GDP, Q1 2024
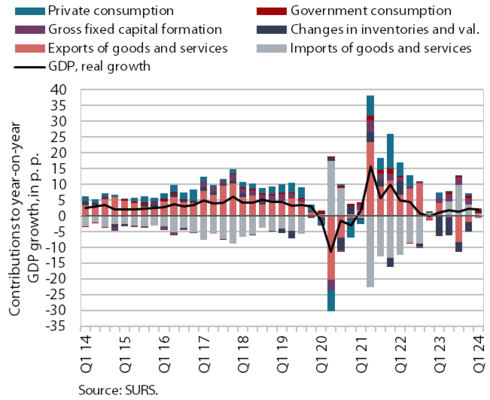
GDP stagnated in the first quarter of this year, while it was 2.1% higher year-on-year (not seasonally adjusted). Household consumption rose by 0.9% year-on-year in the first quarter of 2024, with households spending more on tourist services abroad, cars and food and less on non-food products and overnight stays in Slovenia. The growth in government consumption increased further (by 5.1% year-on-year), mainly due to the transformation of supplementary health insurance into a mandatory contribution (now a public source of funding). Investment activity, following a period of strong growth in the previous year, has weakened (0.6% year-on-year), along with growth in construction activity. After a marked negative contribution last year, inventories made a positive contribution (0.1 p.p.) to the growth in gross investment this time. Exports of goods and value added in manufacturing increased for the second consecutive quarter and were also higher year-on-year. Total exports of goods and services fell by 0.6% due to a decline in exports of services and total imports fell by 0.9%, which had a positive impact on GDP growth as the contribution of the foreign trade balance was 0.2 p.p.
Electricity consumption, April 2024
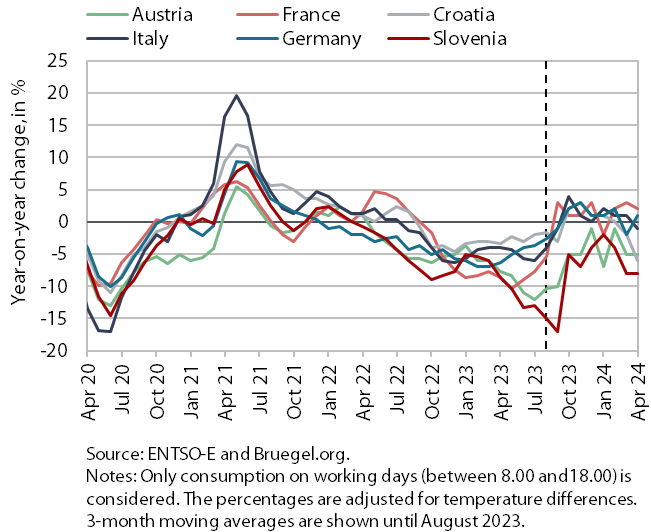
Electricity consumption in April was 8% lower year-on-year. This decline can partly be attributed to numerous power outages due to maintenance works and snowfall. Among Slovenia’s main trading partners, lower consumption compared to April 2023 was recorded by Austria (-5%), Croatia (–6%) and Italy (-1%), while consumption was higher year-on-year in Germany (1%) and France (2%).
Electricity consumption by consumption group, April 2024

In April, the year-on-year decline of electricity consumption in the distribution network was slightly lower, partly due to more working days. With three more working days this April, industrial consumption was 2.3% higher year-on-year, while small business consumption was slightly lower (by 0.9%). Household electricity consumption in April was 6.9% lower year-on-year, partly attributable to frequent power outages due to maintenance works and snowfall.
Value of fiscally verified invoices – nominal, April 2024

The nominal value of fiscally verified invoices was 8% higher year-on-year in April. With three working days more than in April 2023, year-on-year growth in total turnover was higher than on average in the first quarter, when it was 5%. Growth of turnover in trade, which accounted for almost 80% of the total value of fiscally verified invoices, accelerated (from 5% to 7%). Turnover growth in the sales of motor vehicles and retail trade remained relatively strong, and for the first time this year, turnover in wholesale trade was higher year-on-year. Year-on-year turnover growth was strong in accommodation and food service activities and in certain creative, arts, entertainment and sports services and betting and gambling (total growth in accommodation and food service activities and other service activities was 8%, similar to the first quarter).
Trade in goods – in real terms, March 2024
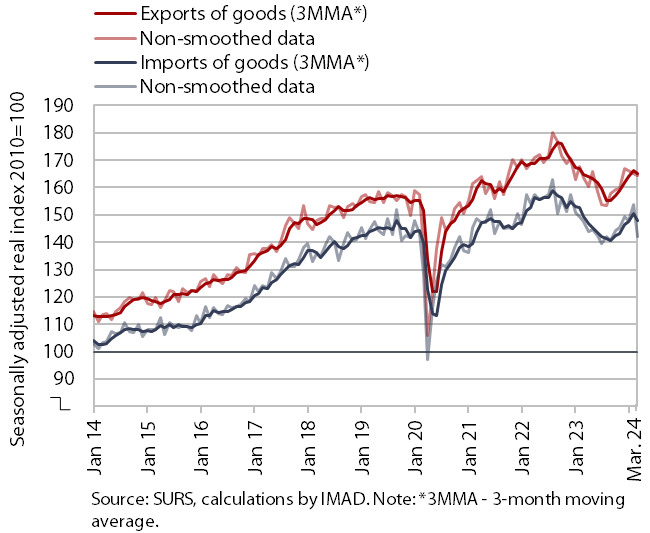
Trade in goods increased month-on-month in the first quarter of this year (seasonally adjusted) but was still lower than a year ago. Real exports of goods declined by 2.1% compared to the previous quarter, while imports fell by 1%, marked by significant monthly fluctuations. Exports of vehicles rose sharply (which also contributed to the sharp increase in exports to France) and exports of chemical products also increased. Imports of intermediate goods and consumer goods contributed to the increase in imports of goods, while imports of capital goods fell (seasonally adjusted). Compared to the same period last year, both exports and imports continued to decline in the first quarter of 2024, with exports to non-EU countries and imports from EU countries experiencing particularly steep declines. In April, sentiment in export-oriented industries remained subdued, and export orders remained at very low levels. In the second quarter, companies continued to cite uncertain economic conditions, weak foreign demand and a shortage of skilled labour as the main limiting factors to business operations.
Trade in services – nominal, March 2024
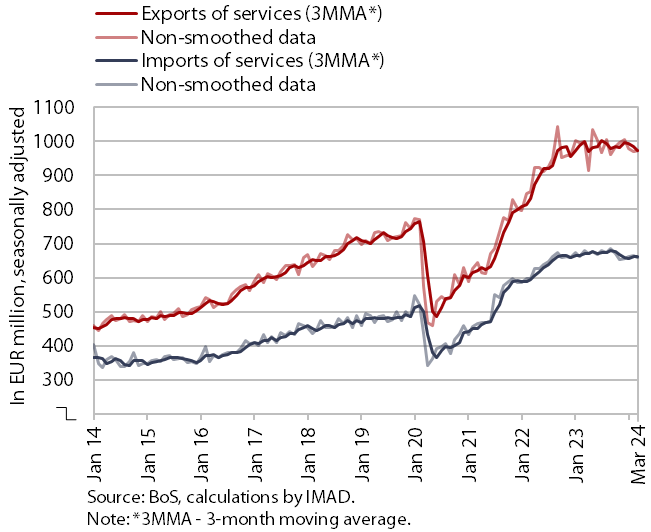
Trade in services increased month-on-month in the first quarter but was lower than in the same period last year. Among the main service groups, exports of tourism-related, construction and ICT services increased compared to the previous quarter. Exports of transport services continued to decline. Exports were also lower in administrative and support service activities, which have experienced marked fluctuations in recent months. Imports of most main service groups increased, with the exception of administrative and support service activities (seasonally adjusted). Trade in services was lower than in the first quarter of last year, primarily due to a significant decline in transport services and administrative and support service activities.
Production volume in manufacturing, March 2024

Despite a decline in March, manufacturing production in the first quarter increased in all industry groups according to technology intensity, while the year-on-year decline was less pronounced compared to the fourth quarter of last year. The relatively sharp year-on-year decline in March (-6.1%) contributed to a 1.8% decline in manufacturing production in the first quarter (growth in the first two months was 0.7). Manufacturing output was lower year-on-year, particularly in some less technology-intensive sectors. In the energy-intensive manufacture of other non-metallic mineral products n.e.c., it fell by almost a fifth, while in the energy-intensive chemical industry it fell by 8.2% and in the wood and furniture industry and the repair and installation of machinery and equipment by around 10%. Industries that surpassed last year’s first-quarter levels mostly recorded modest growth of up to about 4%. The only activities where growth was higher were other manufacturing (14.5%) and the textile industry (8.3%).
Activity in construction, March 2024
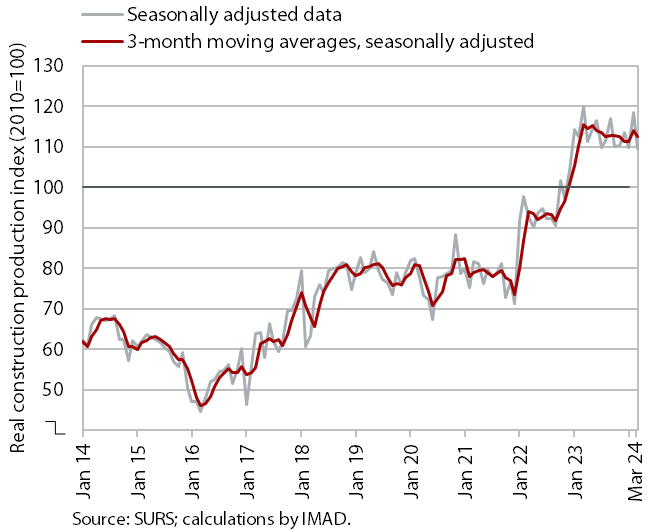
According to data on the value of construction work put in place, construction activity fell in March and was also down year-on-year. After strong growth at the beginning of last year, activity declined gradually amid monthly fluctuations. In the first quarter, it was 3% lower than in the first quarter of last year. The sharpest decline in activity was recorded in building construction (7%).
Some other data, however, point to growth in construction activity. According to VAT data, the activity of construction companies in the first quarter was 8% higher than the same period last year. When compared to the data on the value of construction put in place, this represents a notable difference of 11 p.p. in the growth of this activity.
Turnover in trade, February–March 2024
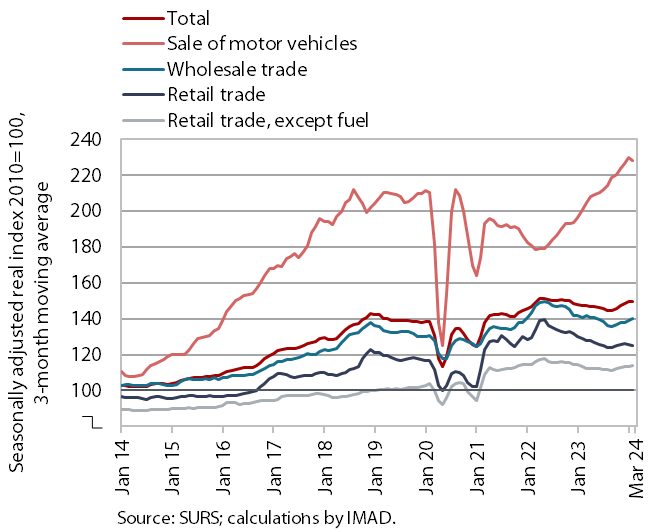
In February, real turnover further increased in most trade sectors and was also higher year-on-year. Following growth in the fourth quarter of last year, turnover further increased in the retail sales of non-food products, which were up 4% year-on-year, and in wholesale trade, which was higher year-on-year for the first time since January 2023 (by 7%). Turnover in retail sales of food, beverages and tobacco products remained higher year-on-year (by 4%), thus maintaining the level achieved in recent months after recording modest growth in the second half of last year. Following strong growth last year, turnover in the sales of motor vehicles fell in February, though it was still significantly higher year-on-year (by 11%). According to preliminary SURS data, turnover in March was again higher year-on-year in the sales of motor vehicles and retail sales of food, while turnover in retail sales of non-food products was lower.
Turnover in market services, February 2024

In February, total real turnover in market services fell significantly (by 1.8%), while it was 1.8% higher year-on-year in real terms. Following robust growth in January, the most significant downturn occurred in information and communication. Additionally, a sharp decline in turnover was recorded in professional and technical activities, where only one sector, a small one in terms of turnover, recorded growth. In accommodation and food service activities, turnover fell for the second month in a row, following a period of relatively strong growth in the fourth quarter of last year. Turnover continued to decline in administrative and support service activities, with further decreases noted in employment services. Only transportation and storage recorded a slight increase in turnover, with both land transport and warehousing and storage contributing to this growth. Year-on-year growth in total turnover of market services slowed significantly in February (from 5.8% in January to 1.8%), and a marked decline was recorded in real estate activities.
Selected indicators of household consumption, February–March 2024

Household consumption in the first quarter was 0.9% higher year-on-year in real terms. The number of new passenger cars used by natural persons sold was 4% higher year-on-year, while spending on tourism services abroad was 5% higher (in nominal terms). Retail sales of food, beverages and tobacco were 4% higher year-on-year in real terms on average in the first quarter, while turnover in the sales of non-food products was 1% lower in real terms due to a weaker March (according to preliminary data). The number of overnight stays by domestic tourists in Slovenia was also lower year-on-year (by 2%). In the first quarter, the nominal value of fiscally verified invoices (a turnover indicator) reached year-on-year growth of 5% in nominal terms, which in a context of lower price growth means higher real growth than in previous quarters.
Economic sentiment, April 2024
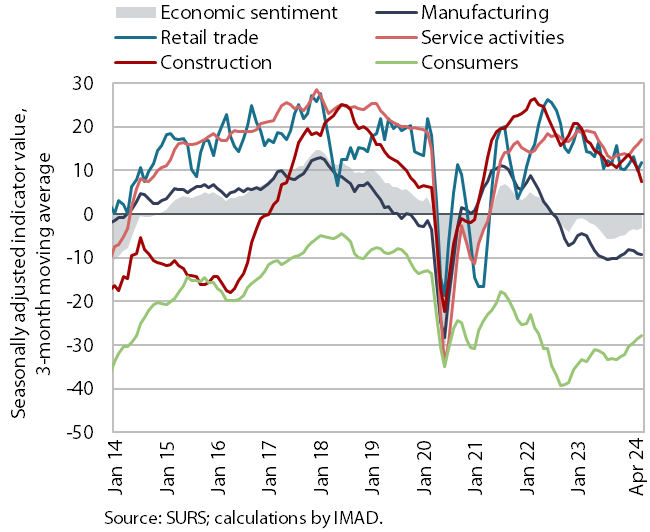
In April, the economic sentiment indicator increased both month-on-month and year-on-year. Compared to March, confidence improved in all activities except construction. Compared to April last year, confidence was slightly higher on average. Broken down by segment, it was higher in manufacturing and retail trade and among consumers, while it was slightly lower in services and significantly lower in construction. Despite reaching its highest level in 13 months, economic confidence remained below the long-term average, though it surpassed it in services, retail trade and construction.
Road and rail freight transport, Q4 2023

Road freight transport further declined in the fourth quarter of 2023, while rail transport experienced growth. The decline in the volume of road transport performed by Slovenian vehicles, which was lower than in the previous two quarters, was still influenced by reduced cross-trade (by more than 2%), while road traffic performed at least partially on Slovenian territory (exports, imports and national transport) exhibited a slight overall increase. Year-on-year, the volume of road goods transport fell by more than one-tenth, and even slightly more compared to the fourth quarter of 2019 (pre-epidemic period). The share of cross-trade, which accounted for half of all goods transport a few years ago, fell to less than 40%. Rail freight transport, which had been on a downward trajectory already before the epidemic, saw a significant increase in the fourth quarter (by 7%). It was also several percentage points higher year-on-year, while it was lower compared to the same period in 2019.
Number of persons in employment, March 2024

The number of persons in employment continued to rise year-on-year in March. Growth was similar (1.4%) to the first two months of the year and higher than in the final months of 2023. The acceleration was mainly due to a change in the definition of persons in employment, which now also includes workers posted abroad. Growth was the highest in construction, which faces severe labour shortage, and the increase was further boosted by the aforementioned change in the definition of the labour force. The year-on-year increase in the total number of persons in employment was due to the higher number of employed foreign nationals, while the number of employed Slovenian citizens fell. The share of foreign citizens among all persons in employment was 15.6% in March, 1.4 p.p. higher than a year earlier. Notably, the activities with the largest shares of foreign workers were construction (50%), transportation and storage (33%), and administrative and support service activities (29%).
Number of registered unemployed, April 2024
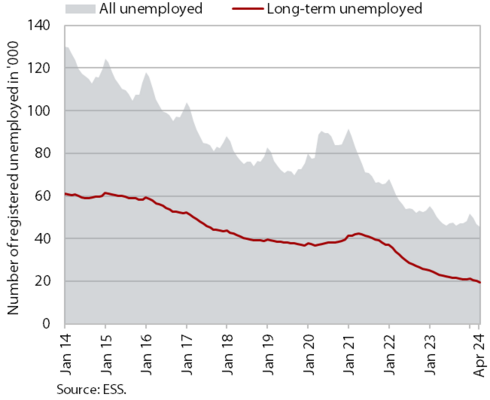
According to the seasonally adjusted data, the monthly decline in the number of registered unemployed was similar in April (1.1%) as in the previous two months. According to original data, 45,219 people were unemployed at the end of April, 7% less than a year ago. Amid labour shortages, the number of long-term unemployed (more than one year) fell by 14.8% year-on-year at the end of April, while the number of unemployed over 50 fell by 9.2%.
Average real gross wage per employee, February 2024

In February, the average gross wage growth (3.4%) was slightly lower in real terms compared to January. With inflation largely unchanged, this was mainly due to last year’s high base effect related to the increase in the minimum wage, which was higher than this year. In the private sector, the average gross wage in February increased by 3.9% year-on-year in real terms, with the highest growth observed in construction, transportation and storage. Real growth in the public sector was 2.4%.
Nominal year-on-year growth in the average gross wage (6.9%) was slightly lower than in previous months. Growth was 7.4% in the private sector and 5.9% in the public sector.
Consumer prices, April 2024
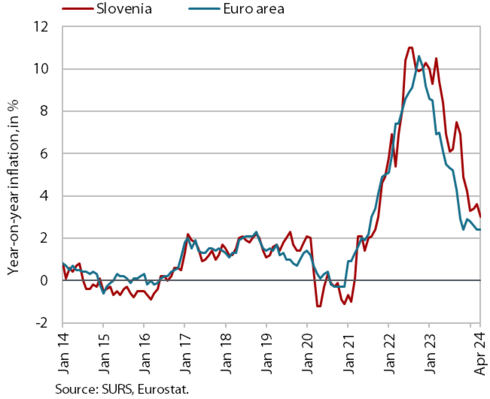
After a slight increase in the preceding two months, year-on-year growth of consumer prices fell to 3% in April, marking the lowest level since October 2021. The slowdown in year-on-year growth was primarily driven by a less pronounced seasonal increase in prices of package holidays (rising by 13.8% month-on-month). The year-on-year price increase in the recreation and culture group nearly halved compared to March (3.2%), while the growth in services prices decreased by around one-quarter to 4.5%. Similarly, the seasonal price hike in the clothing and footwear group was less pronounced (4.2%), contributing to lower price growth in semi-durable goods, which increased by 1.8% year-on-year. Prices in the food and non-alcoholic beverages group fell by 1% month-on-month but remained stable year-on-year. The prices of durable goods fell year-on-year (-0.7%). Among the 12 groups of goods and services, the most significant price increases were observed in the restaurants and hotels group (7.3% year-on-year), where growth accelerated again after a slowdown at the beginning of the year. Prices in the education and health groups are also rising rapidly (by 6.6% and 6.1% respectively).
Slovenian industrial producer prices, March 2024
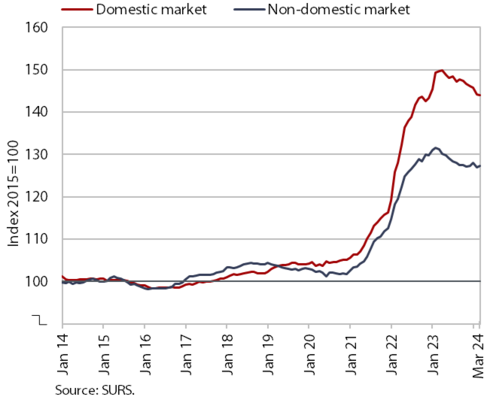
In March, industrial producer prices saw a slight month-on-month increase (0.1%), while the year-on-year decline has slowed somewhat (-3.3%). The monthly increase was mainly due to a 4.1% rise in energy prices, with prices for capital goods (0.5%) and consumer goods (0.2%) also experiencing a slight rise. Prices of intermediate goods fell slightly and the year-on-year decline in prices in this group accelerated slightly (-5.8%). Against the backdrop of relatively high monthly price increases, the year-on-year price decline in the energy product group slowed somewhat, though remaining substantial at 12.2%. The growth of prices for capital and consumer goods continued to weaken, registering a year-on-year increase of slightly below 1%. The decline in Slovenian producer prices was somewhat more pronounced on the domestic market (-3.7%) than on the foreign markets (-3.0%).
Loans to domestic non-banking sectors, March 2024

The growth of loans to domestic non-banking sectors strengthened slightly year-on-year in March but remains relatively modest (1.3%). A large part of the growth stems from household borrowing, where consumer credit has increased rapidly since the middle of last year, with a year-on-year rise of almost 15%. New loans to households in the form of consumer loans in the first quarter amounted to EUR 386.6 million, almost 50% higher than in the same period last year. The year-on-year increase in housing loans has stabilised at around 1% over recent months. The volume of corporate and NFI loans fell by 2.2% year-on-year in March, but the decline has slowed in recent months. Growth in domestic non-banking sector deposits has been around 3% since the end of last year. In recent months, the year-on-year growth in corporate deposits (5.7% in March) was significantly higher than that of household deposits (2.3% in March). Amid low deposit interest rates and the supply of government bonds for private investors, the volume of household deposits actually fell slightly in the first quarter of this year. The quality of banks’ assets remains solid and the share of non-performing loans remained unchanged at 1% at the beginning of the year.
Current account of the balance of payments, March 2024

In the first quarter of this year, the current account surplus widened year-on-year. This was mainly due to the goods trade balance. Real exports of goods increased year-on-year while imports fell and the terms of trade improved due to a further decline in energy and industrial producer prices. We estimate that volume and price movements contributed similarly to the year-on-year change in the nominal goods trade balance (EUR 261 million) in the first quarter. The surplus in trade in services was lower year-on-year, mainly due to a lower surplus in trade in transport services. The primary income deficit was similar to that in the same period last year. The lower secondary income deficit resulted mainly from lower net outflows of general government transfers to the rest of the world. The 12-month balance of the current account of the balance of payments showed a surplus of EUR 3.1 billion in March (4.6% of estimated GDP).
Revenue (top figure) and expenditure (bottom figure) of the consolidated general government budgetary accounts, Q1 2024
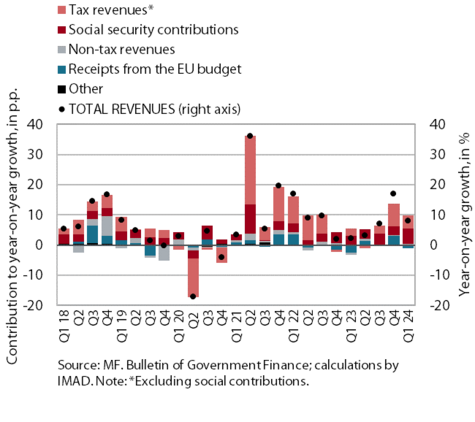

In the first quarter of this year, the deficit of the consolidated balance of public finances was higher year-on-year. It totalled EUR 372 million, compared to EUR 294 million in the same period last year. Revenues increased by 8.1% year-on-year in the first quarter. In addition to revenues from social contributions due to the transformation of the supplementary health contribution into a mandatory contribution, the first quarter of this year saw a strong upturn in personal income tax revenues, which had stagnated in the same period last year due to increased tax relief, while this year’s increase is also due to the non-adjustment of the tax relief and tax base. The dynamics of the adoption of measures to mitigate the consequences of rising prices and last year’s late payment by some excise registrants have led to lower growth in excise duty revenues this year. Total revenues from the EU budget declined year-on-year, after Slovenia received funds based on the second payment request under the Recovery and Resilience Facility (RRF) at the end of last year. Expenditure increased by 9% year-on-year in the first quarter. The main contributors were expenditure on salaries, wages and other personnel expenditure, which were influenced by the agreement on pay rises in the public sector and the early payment of the holiday allowance, the increase in expenditure on goods and services and other healthcare expenditure in connection with the transformation of the supplementary health insurance into a mandatory contribution, and transfers to individuals and households, partly as a result of the high regular annual indexation of pensions. Growth in capital expenditure strengthened (27.4%). Subsidies to companies for the mitigation of the effects of rising energy prices, which saw a marked increase last year, were lower year-on-year. From August 2023 to the end of March 2024, EUR 633 million was disbursed from the state budget to rectify the consequences of floods and landslides, of which EUR 75 million was disbursed in the first three months of this year, most of it for ongoing maintenance and insurance under the emergency Flood Recovery Act.
EU budget receipts, March 2024 (top figure) and absorption of 2014–2020 ECP funds (EU part) for the period 1 January 2014–31 March 2024 (bottom figure)
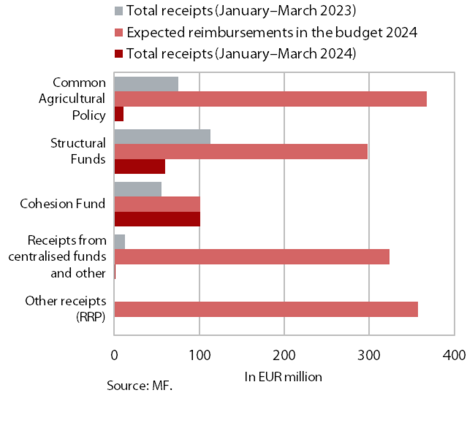

Slovenia’s net budgetary position against the EU budget was positive in the first three months of 2024 (at EUR 46.8 million). In this period, Slovenia received EUR 190.1 million from the EU budget (13.1% of receipts envisaged in the adopted state budget for 2024) and paid EUR 143.2 million into it (19.9% of planned payments). The bulk of receipts (53.3% of all reimbursements to the state budget, 100.4% of the planned reimbursements in 2024) were resources from the Cohesion Fund and from structural funds (31.4% of all reimbursements to the state budget, 20% of the planned reimbursements in 2024). Receipts for the implementation of the Common Agricultural and Fisheries Policies amounted to 5.7% of all reimbursements (3% of the planned reimbursements in 2024). The highest payments into the EU budget came from GNI-based payments (47% of all payments).
According to the MKRR data, under the Operational Programme for the Implementation of EU Cohesion Policy 2014–2020 (from January 2014 to the end of March 2024), payments from the state budget totalled EUR 3.53 billion (EU share). This corresponds to 106% of the available funds, while certain payments from the state budget are still planned for the first half of 2024 (about EUR 66 million according to estimates made by line ministries). Under the Operational Programme for the Implementation of EU Cohesion Policy 2021–2027 (from January 2021 to the end of March 2024), payments from the state budget totalled EUR 23.9 million (EU share), which corresponds to 1% of the available funds.
