Charts of the Week
Charts of the week from 8 to 12 September 2025: production output in manufacturing, current account of the balance of payments and electricity consumption by consumption group
Manufacturing output increased in July on a monthly basis (seasonally adjusted), following a contraction in the second quarter; in the first seven months, it was 1.1% lower year-on-year. Output in high-technology industries remained higher than a year earlier, while the sharpest declines were recorded in the manufacture of motor vehicles and other transport equipment and in the metal industry. The 12-month current account surplus (up to July) was EUR 1.2 billion lower than in the previous 12-month period, mainly due to a deterioration in the goods trade balance and in the secondary income balance. Electricity consumption in the distribution network was 4.4% lower year-on-year in August, partly due to one fewer working day.
Production output in manufacturing, July 2025

Manufacturing output increased in July on a monthly basis (seasonally adjusted), after contracting in the second quarter; in the first seven months it was 1.1% lower year-on-year (working-day adjusted). After a downturn in the second quarter, output in high-technology industries increased more strongly in July. Output in low and medium low-technology industries also rose slightly. Following modest growth in the second quarter, output in medium-high-technology industries declined again (all seasonally adjusted). In July, output was lower year-on-year in all medium-high-technology industries, while in the first seven months as a whole, year-on-year growth within this group was recorded only in the energy-intensive chemical industry. The steepest decline in the first seven months was in the manufacture of motor vehicles and other transport equipment (-13.4%). Output in the metal industry was also lower year-on-year (–5.4%). The contraction was particularly pronounced in the manufacture of fabricated metal products (–6.3%), while the decline in the manufacture of basic metals was more moderate, at half that rate. Output in high-technology industries (in our assessment, primarily in the pharmaceutical industry) and in certain less technology-intensive industries remained higher than a year earlier.
Current account of the balance of payments, July 2025
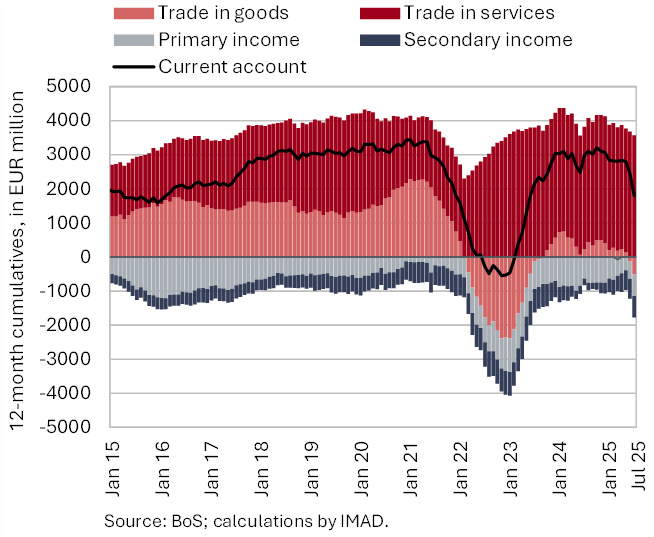
The 12-month current account surplus (until July) decreased by EUR 1,2 billion compared to the previous 12-month period, amounting to EUR 1.8 billion (2.5% of estimated GDP). This was mainly due to the goods trade balance (shifting from surplus to deficit) and the secondary income balance. Amid the decline in exports, the deterioration in the goods trade balance was due to a higher deficit in trade with EU countries, while the higher deficit in secondary income mainly reflected lower receipts of funds for current international cooperation from the EU budget. The services surplus was also lower year-on-year, particularly in trade in construction services, charges for the use of intellectual property, and trade in travel services. The primary income deficit, however, remained roughly unchanged.
Electricity consumption by consumption group, August 2025

In August, electricity consumption in the distribution network was 4.4% lower year-on-year, with one fewer working day this August. Industrial consumption and household consumption were lower (by 5.2% and 4.3%, respectively) while only small business consumption was higher (0.6%).