Charts of the Week
Charts of the week from 26 to 30 August 2024: consumer prices, active and inactive population, turnover in trade and other charts
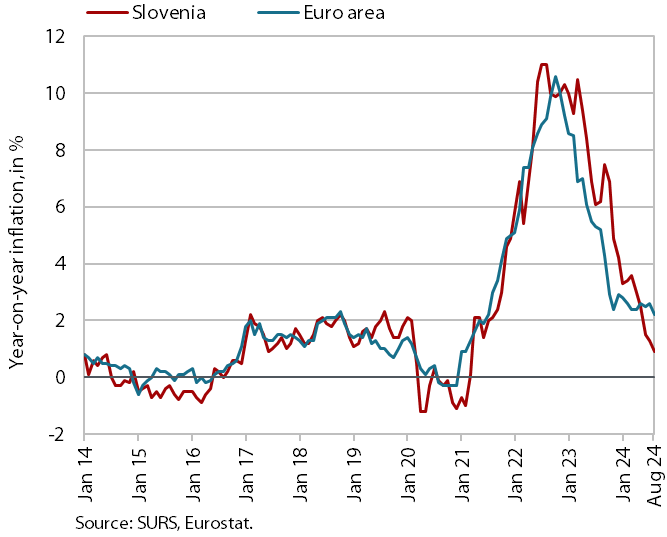
Inflation continued to decrease in August, reaching 0.9% year-on-year. This decline was again primarily driven by the seasonal, above-average price drop in the clothing and footwear group. The year-on-year increase in services prices remained above 4%. In the second quarter, real turnover declined in most trade sectors; however, turnover in wholesale trade, which is rebounding, and sales of motor vehicles, despite a quarter-on-quarter drop, both saw year-on-year increases. Real turnover in market services decreased in most activities in the second quarter, though it remained higher year-on-year. According to survey data, the number of unemployed declined by 5.4% year-on-year in the second quarter, while the number of persons in employment increased slightly. After a decline in July, economic sentiment improved again in August.
Consumer prices, August 2024

The moderation of year-on-year price growth continued in August (0.9%). For the second consecutive month, the above-average seasonal price decline in the clothing and footwear group made the largest contribution to moderating inflation, with prices falling by 17.5% compared to June. Prices in this group were still 1.7% higher year-on-year at the end of June but decreased by 6.5% in August. This indicates a 4.6% year-on-year drop in the prices of semi-durable goods, while the decline in prices of non-durable consumer goods remained unchanged (1.2%). The rise in services prices also slowed slightly year-on-year in August, although it remained at a high level of 4.1%. Based on available data, we attribute the slightly lower growth (0.3 p.p.) to the monthly decline in services prices within the transport group (transport services and other services in respect of personal transport equipment). The year-on-year price increases in the recreation and culture (3.0%) and education groups remained largely unchanged in August. The strongest year-on-year price increase (6.7%) was still recorded in the restaurants and hotels group, where growth accelerated compared to July. After a slowdown over the past three months, price growth also accelerated in the health group (4.4%).
Active and inactive population, Q2 2024

According to survey data, the number of unemployed declined year-on-year in the second quarter, while the number of persons in employment increased slightly. Thirty-five thousand persons were unemployed, which is 5.4% less than in the second quarter of last year. The survey unemployment rate (3.4%) fell by 0.2 p.p. year-on-year. With the moderation in economic growth, the year-on-year increase in the number of persons in employment (0.2%) was less pronounced compared to the previous two quarters. The number of employees and self-employed persons increased, while the number of unpaid family workers declined.
Turnover in trade, June–July 2024

Real turnover in most trade sectors declined in the second quarter or remained at the same level as the first quarter. Only turnover in wholesale trade increased, marking the first year-on-year rise in five quarters. Turnover in the sales of motor vehicles also continued to grow year-on-year, although after significant growth last year, it has been declining quarter-on-quarter this year. Turnover in retail sales of food, beverages and tobacco was similar to the first quarter of this year and the second quarter of last year, while turnover in retail sales of non-food products was down both quarter-on-quarter and year-on-year. According to preliminary SURS data, turnover in retail trade and sales of motor vehicle sales increased in July and was also up year-on-year.
Turnover in market services, June 2023

Real turnover in market services declined in most activities in the second quarter, though it was higher year-on-year (by 1.7%). After growth in the first quarter, total turnover fell by 1.8% quarter-on-quarter in the second quarter. In transportation and storage, the decline in turnover persisted, though it was less pronounced than in the first quarter, with air transport and postal services contributing to the decline this time. For the second consecutive quarter, turnover in accommodation and food service activities was similar to the level recorded at the end of last year when a significant increase was observed. Turnover in other market activities decreased again, with the least pronounced decline in administrative and support service activities, and a renewed significant decline in employment services. Information and communication saw a more marked decline, largely driven by a decline in sales of computer services in both domestic and foreign markets. The largest decline occurred in professional and technical activities, with a significant drop in architectural and engineering services. Only real estate activities continued to see an increase in turnover. In the first half of the year, only transportation and storage recorded a year-on-year decline in real turnover.
Economic sentiment, August 2024

After a decline in July, economic sentiment improved again in August. This time, the monthly improvement was driven by higher confidence indicators in all activities and among consumers. Compared to August last year, confidence remained lower in construction and, for the first time this year, in retail trade. Amid significant fluctuations in the retail trade confidence indicator, the inventories indicator in particular deteriorated in August.
