Charts of the Week
Charts of the week from 21 July to 14 August 2025: GDP, economic sentiment, consumer prices, unemployment and other charts
Following a contraction in the first quarter, economic activity expanded in the second quarter, both quarter-on-quarter (0.7%, seasonally adjusted) and year-on-year (0.7%). In July, the economic sentiment indicator in Slovenia strengthened slightly, with the year-on-year decline being more moderate than in June, when it had deteriorated sharply. Year-on-year inflation accelerated to 2.8%, driven primarily by higher prices of food and non-alcoholic beverages, which have been rising in recent months and contributed significantly to year-on-year inflation. In the last month, electricity prices have also increased due to a change in charges. At the end of July, 43,799 people were unemployed, 3.3% more than at the end of June, reflecting a larger inflow of first-time jobseekers and a higher inflow into unemployment due to the expiry of fixed-term employment contracts. Year-on-year, the number of unemployed was 1.3% lower, marking a slower pace of decline compared to previous months. Electricity consumption in the distribution network was lower year-on-year in July. The current account surplus narrowed year-on-year in the second quarter, mainly due to the trade balance – real goods exports declined, while goods imports increased. In manufacturing, output rose in May and June, but the sharp decline in April resulted in an overall quarter-on-quarter contraction. The sharpest decline was recorded in high-technology industries, further exacerbating the year-on-year contraction in manufacturing output in the second quarter. The value of construction works increased in the second quarter, but remained lower year-on-year in the first half of the year. In May, real turnover in trade rose both month-on-month and year-on-year across all trade segments. In contrast, turnover in market services continued to fall and remained below last year’s level for the second consecutive month.
GDP, Q2 2025
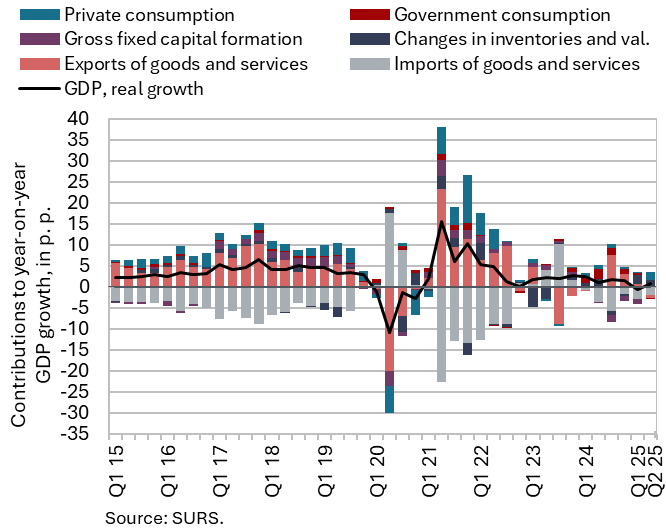
Following a contraction in the first quarter, economic activity rebounded in the second quarter, recording growth on both a quarterly and an annual basis. GDP rose by 0.7% quarter-on-quarter (seasonally adjusted) and by 0.7% year-on-year. After a weak first quarter, private consumption growth strengthened (3.6%) and, compared to the same period last year, made the strongest positive contribution to economic activity. Gross fixed capital formation, after a significant year-on-year decline in the first quarter, remained close to the level of the second quarter of last year (down by 0.2%). Year-on-year growth was recorded mainly in construction investment, although civil engineering still lagged behind the level observed in the same period last year. Government consumption was 0.5% lower year-on-year, reflecting the high base effect (post-flood reconstruction, mandatory health contribution). Activity in the export sector of the economy continued to contract. With exports declining and imports increasing, the contribution of the balance of trade to GDP growth decreased by 2.7 p.p. The contribution of inventories to economic growth was again strongly positive in the second quarter (1.7 p.p.) and only slightly lower than in the first quarter. In the first half of the year, GDP was approximately at the level of the same period last year (0.1%).
Economic sentiment, July 2025
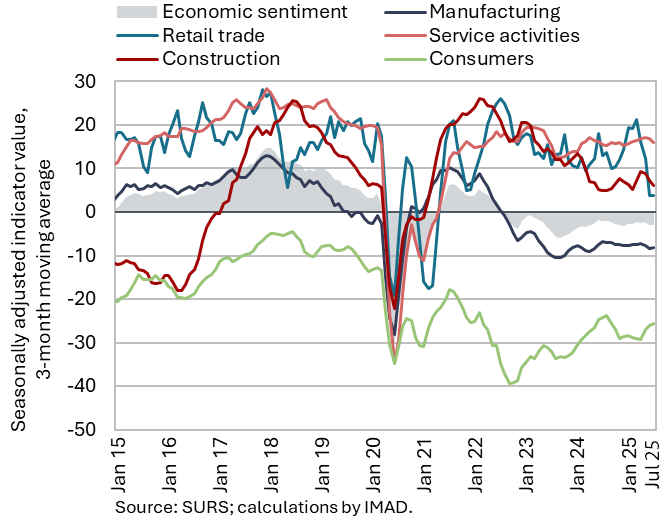
In July, the value of the economic sentiment indicator increased by 0.5 p.p. compared with June. The confidence indicators in retail trade, manufacturing and construction increased. By contrast, consumer confidence and the value of the confidence indicator in services decreased. Compared with July last year, the value of the confidence indicator, following a significant deterioration in June, decreased by 0.8 p.p. This was due to lower consumer confidence, while the confidence indicators in construction and retail trade were higher. The economic sentiment indicator thus remains slightly below its long-term average, with only the values of confidence indicators in construction and services still exceeding their respective long-term averages.
Consumer prices, July 2025
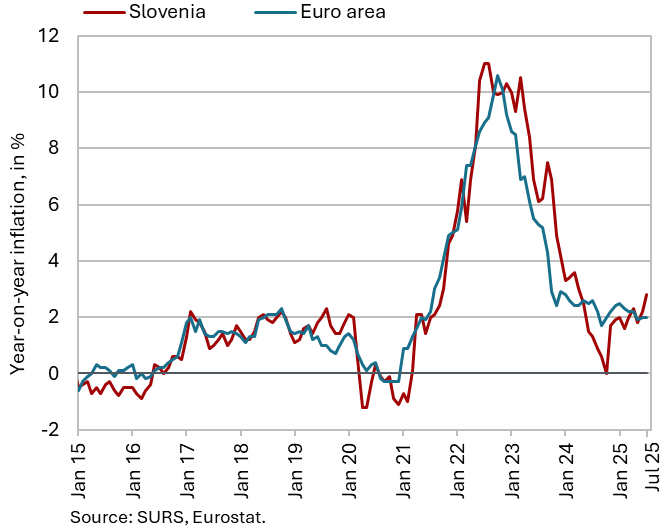
Year-on-year growth in consumer prices strengthened slightly in July, to 2.8%, while on a monthly basis prices rose by 0.5%. In addition to seasonal factors (including a 12.4% increase in package holiday prices), a significant contribution to monthly growth came from higher electricity prices (up 7.4%) due to the reintroduction of the RES and CHP contribution. Prices of fuels and lubricants for personal transport equipment also increased slightly (up 1.5%). Prices in the food and non-alcoholic beverages group continued to rise (up 0.6%). These were already 7.7% higher year-on-year and accounted for half of year-on-year inflation. Year-on-year growth in semi-durable goods prices reached 1.3% in July, while prices of durable goods were 0.5% higher. Price increases in the restaurants and hotels group (5.6%) and in the recreation and culture group (3.0%) also contributed to the acceleration of year-on-year service price growth, which rose by 0.4 p.p. compared with June, reaching 3.0%. Inflation as measured by HICP rose to 2.9% in July, exceeding the euro area average by 0.9 p.p. Based on the available data, we estimate that the difference is mainly the result of significantly higher growth in goods prices in the food, beverages and tobacco groups (7.1%), compared with 3.3% in the euro area.
Unemployment, July 2025
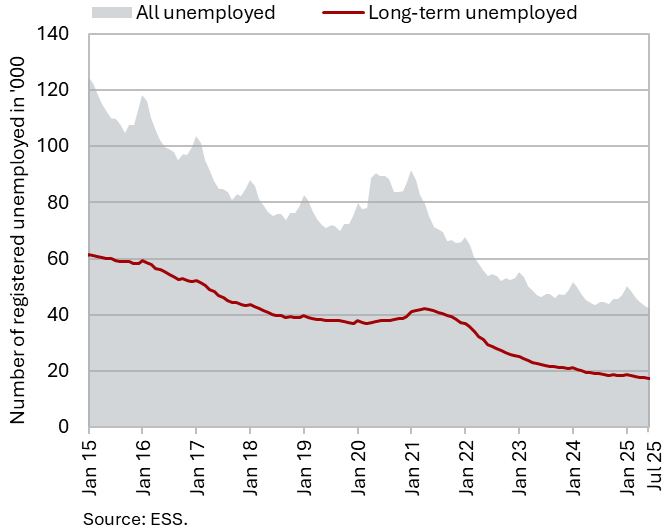
In July, the number of registered unemployed persons (seasonally adjusted) increased slightly (by 0.2%). According to original data, 43,799 people were unemployed at the end of July, 3.3% more than at the end of June. The inflow of first-time jobseekers and the inflow into unemployment due to the expiry of fixed-term contracts both increased. Year-on-year, the number of unemployed was 1.3% lower, marking a lower decrease compared to previous months. The year-on-year decline in the number of long-term unemployed (–9.3%) remained largely unchanged, while the decrease in the number of unemployed persons aged over 55 (–10.4%) was slightly smaller than in previous months. Youth unemployment (ages 15–29) has been increasing year-on-year since the end of last year (6.7% higher year-on-year).
Electricity consumption by consumption group, July 2025
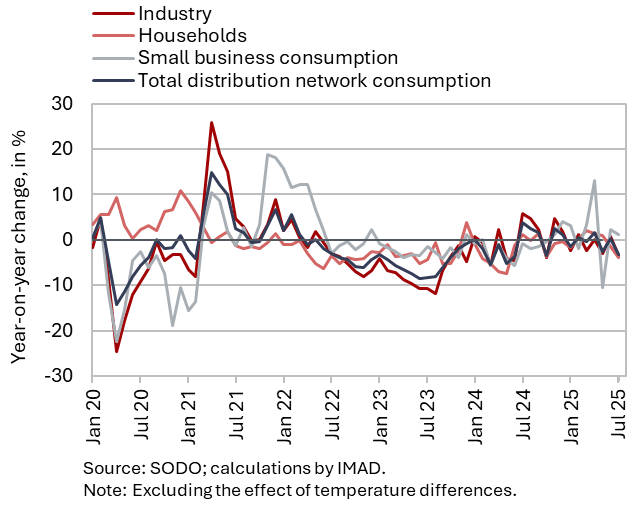
Electricity consumption in the distribution network was 3.1% lower year-on-year in July. With the same number of working days, industrial consumption, which can serve as an indicator of economic activity, was 3.4% lower year-on-year. Household consumption was also lower year-on-year (by 3.9%), while small business consumption (which accounts for only a small share of total consumption) was 1.3% higher year-on-year. Electricity consumption in July was also affected by outages due to severe weather events.
Exports and imports of goods, June 2025
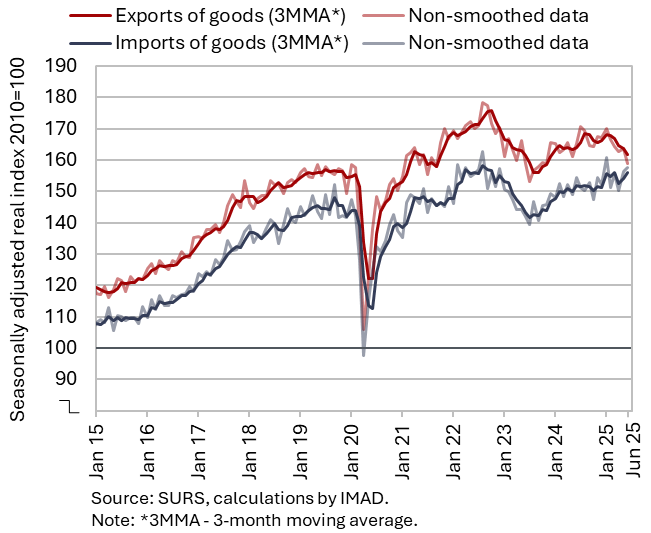
In the second quarter, goods exports declined both quarter-on-quarter (seasonally adjusted) and year-on-year, while imports increased. Compared with the previous quarter, real goods exports fell by 3.1%, largely due to a sharp decline in exports to non-EU countries (–4.2%). Exports to EU countries also declined (–2.4%). Quarter-on-quarter, the decrease was driven mainly by lower exports of intermediate goods (metals and metal products and certain other materials), which account for around half of total goods exports. The 0.2% quarter-on-quarter increase in goods imports was driven by higher imports of consumer goods and capital goods, while imports of intermediate goods declined (all seasonally adjusted). Compared with the same period last year, exports were lower in the second quarter (–1.5%), while imports were higher (1.8%).
Export orders remained weak at the beginning of the third quarter, with particularly negative developments among the larger industries in the manufacture of basic metals and fabricated metal products, rubber products, and electrical equipment.
Current account of the balance of payments, June 2025
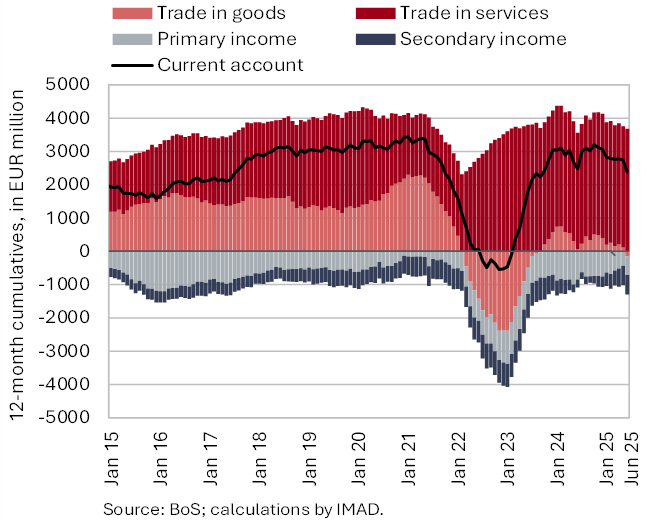
The current account surplus was lower year-on-year in the second quarter. This was mainly due to the goods trade balance. Real exports of goods in the second quarter was lower year-on-year, while imports of goods was higher. The terms of trade have improved. We estimate that quantity fluctuations contributed EUR 427 million to the year-on-year change in the balance of goods trade in the second quarter (EUR 310 million), while the effect of terms of trade was positive, amounting to EUR 117 million. The surplus in services was higher year-on-year, mainly due to a larger surplus in the trade of transport, travel, and research and development services. The deficit in primary income was lower year-on-year in the second quarter, mostly due to lower net outflows of equity income from direct investment. The higher secondary income deficit resulted from lower transfers received by the general government from the EU budget, and partly also from higher transfers paid by the private sector to the rest of the world. On an annual basis, the surplus of current transactions has also been gradually declining. The 12-month current account balance showed a surplus of EUR 2.4 billion in June (3.4% of estimated GDP for 2025).
Production volume in manufacturing, June 2025
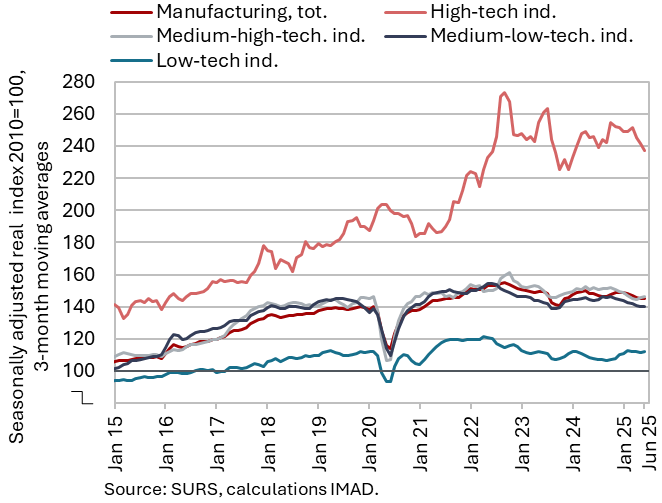
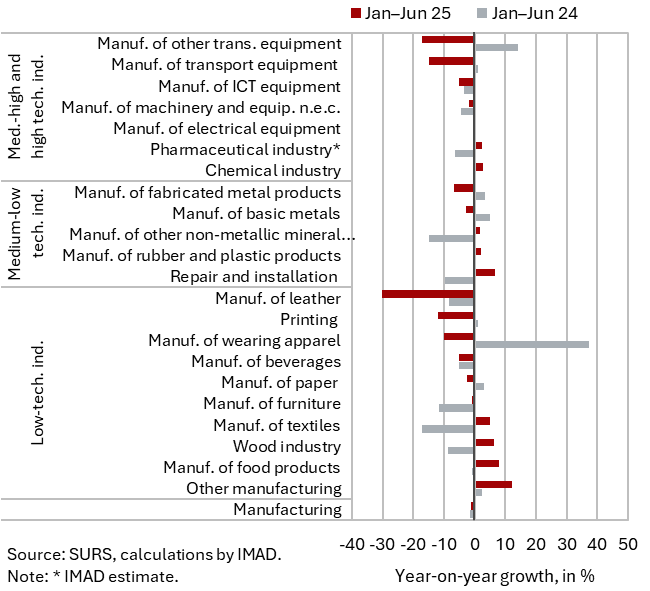
After contracting in April, manufacturing output increased month-on-month in May and June, but on average in the second quarter it lagged behind the first (seasonally adjusted). The sharpest decline (compared with the first quarter) was recorded in high-technology industries, which are characterised by pronounced monthly volatility. Output in medium-low-technology industries also declined somewhat, while output in medium-high- and low-technology industries remained similar to that of the first quarter (all seasonally adjusted). The year-on-year decline in manufacturing output deepened in the second quarter (–2.1%). After six months, output was 1.8% lower than a year earlier (both working days adjusted). It was lower in the energy-intensive paper industry and basic metals manufacture (following growth in 2024), while in the chemical industry and the manufacture of non-metallic mineral products, output remained higher year-on-year; however, output in the former declined year-on-year in the second quarter, while in the latter it stagnated. Output was also lower than in the first half of the previous year in most more technology-intensive industries. The largest decline, after a drop in 2024, was in the manufacture of transport equipment (down -15%; only the decline in the manufacture of leather products was more pronounced, at –30%). Output also fell in the medium-low-technology metal industry (by -5.7%), which, along with the pharmaceutical industry, is the largest manufacturing industry. In our assessment, output in the pharmaceutical industry, despite the moderation in the second quarter, increased year-on-year. On average, output in low-technology industries was also higher than a year earlier.
Activity in construction, June 2025
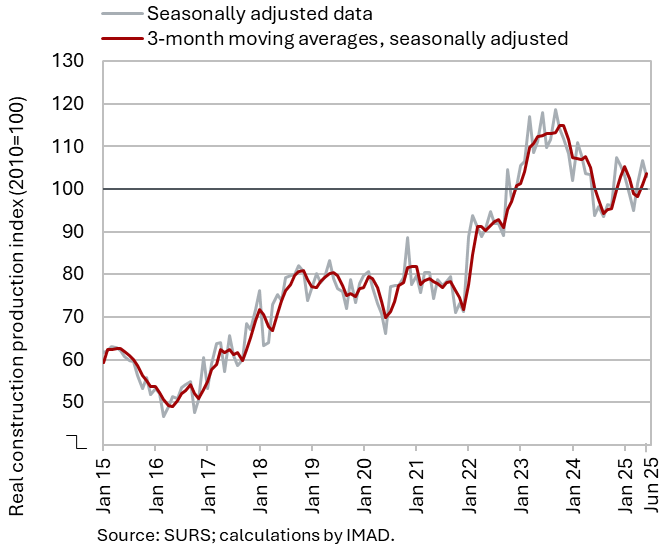
Amid significant monthly fluctuations, construction activity increased in the second quarter. Construction activity fell by 4% quarter-on-quarter in the first quarter, but rose by 5% in the second. In the first half of this year, construction activity was thus 2% lower than in the same period last year. Activity increased in specialised construction activities (by 7%) and in the construction of non-residential buildings (by 5%), remained unchanged in the construction of residential buildings, and declined by 13% in civil engineering.
Capital expenditure (according to the consolidated general government budgetary accounts) was 5% higher year-on-year in the first half of the year; within this, expenditure on new constructions, reconstructions, and renovations – which, in our assessment, is most closely related to construction activity – increased by 3%. The lower activity in civil engineering at the beginning of this year is therefore most likely related to lower investment by infrastructure companies and/or budgetary funds.
Turnover in trade, May 2025
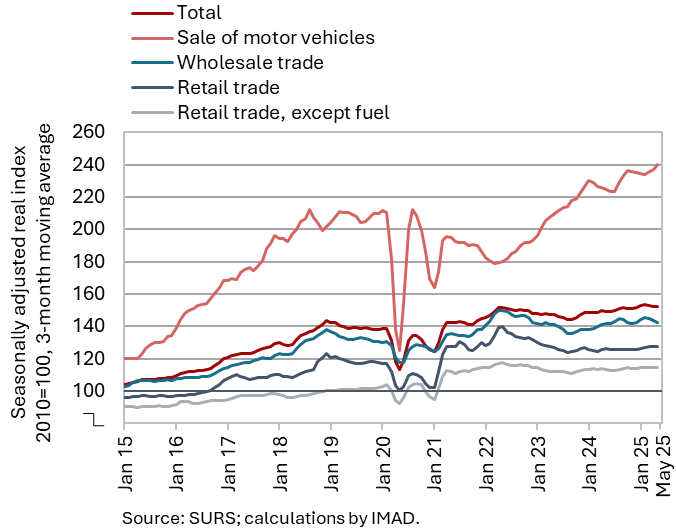
Real turnover in all trade sectors was higher year-on-year in May and in the first five months as a whole. Turnover in retail trade with food products strengthened for the second consecutive month in May, following a decline in the first quarter. Following stagnation or growth in the first quarter, turnover also increased in the trade of motor vehicles and in retail trade with non-food products. After a sharp decline in March, turnover in wholesale trade increased in April and May, but remained below the average recorded in the first quarter. Sales in all trade sectors were also higher year-on-year in May and cumulatively over the first five months; the strongest growth was recorded in the trade of motor vehicles (5%), while growth in other trade sectors was considerably more modest (around 2% on average).
Turnover in market services, May 2025
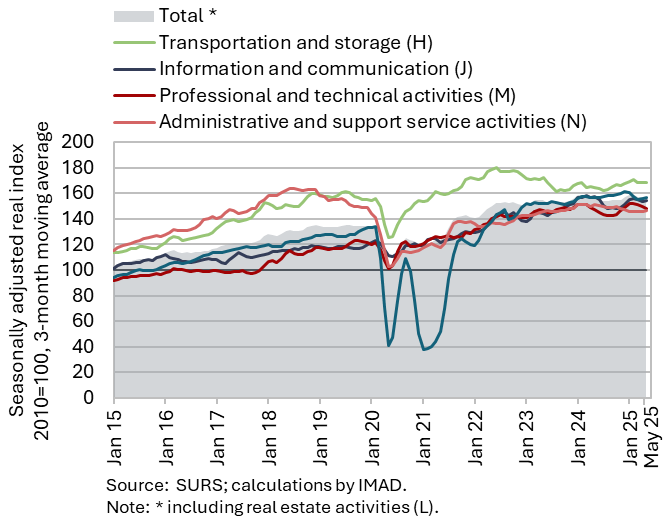
Total real turnover in market services continued to decline in May and was, for the second consecutive month, also lower year-on-year (by 1.8% in May). After stagnating in the first quarter, it has been decreasing since the beginning of the second; in May it declined by 1% compared to April. Turnover continued to contract in professional and technical activities, where negative trends have persisted since early spring this year. In the past three months, turnover fell markedly also in architectural and engineering services. In transportation and storage, which had generally been expanding since mid-2024, turnover decreased slightly; in May, a decline was observed in postal and storage activities. In May, turnover in accommodation and food service activities remained broadly unchanged relative to April, when it had risen strongly following a contraction in the first quarter. Turnover rose sharply in administrative and support service activities, despite a continued contraction in employment services, where the negative trend has persisted since the second quarter of last year. In information and communication, turnover increased again slightly after strong growth in the first quarter, mainly due to higher sales of telecommunications services on both domestic and foreign markets. In the first five months of 2025, real turnover increased year-on-year in transportation and storage and in professional and technical activities.