Charts of the Week
Charts of the week from 13 to 17 November 2023: gross domestic product, value of fiscally verified invoices, electricity consumption by consumption group and other charts
Real GDP fell in the third quarter compared to the second quarter (by 0.2%), but was higher year-on-year (by 1.1%), partly due to last year’s lower base. Year-on-year growth was driven by construction investment and government consumption and by some service activities. Household consumption declined slightly year-on-year, while international trade, particularly trade in goods, recorded a larger decline. Construction activity picked up considerably in September with the recovery from the August floods and was significantly higher in the third quarter than in the same period last year. Year-on-year growth in the number of persons in employment in construction continued to slow in September, which, together with a fall in the number of persons in employment in manufacturing, contributed to a further decline in year-on-year growth in the total number of persons in employment (0.9%). Electricity consumption in the distribution network was lower year-on-year in October, with a less pronounced decline in industrial consumption than in previous months. The nominal value of fiscally verified invoices at the beginning of November increased by 5% year-on-year. Turnover growth in trade, which accounts for the bulk of the total value of fiscally verified invoices, accelerated again, partly due to the difference in the timing of the last working day before the holidays this year and last year. In the third quarter, the current account of the balance of payments showed a surplus again, which was mainly due to the goods trade balance.
Gross domestic product, Q3 2023
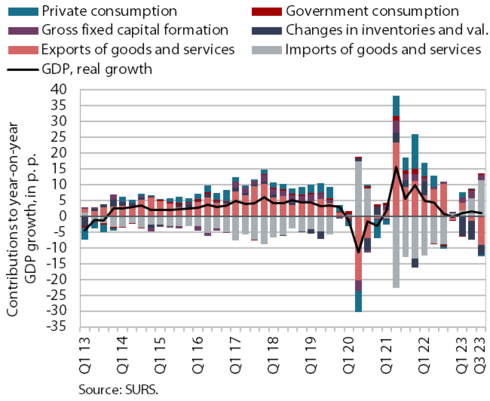
In the third quarter of 2023, real gross domestic product (GDP) fell by 0.2% quarter-on-quarter, while it increased by 1.1% year-on-year (not seasonally adjusted). Year-on-year growth was driven by construction investment and government consumption and by some service activities. After household consumption had risen in the first half of the year, it fell year-on-year. International trade, particularly in goods, also declined year-on-year. The decline in imports was stronger than that in exports, as the latter was affected by the continued year-on-year fall in domestic consumption. The contribution of the external trade balance of goods and services was thus again highly positive, at 2.4 p.p. Value added in the predominantly export-oriented manufacturing activities remained unchanged year-on-year.
Value of fiscally verified invoices, in nominal terms, 29 October–11 November 2023

The nominal value of fiscally verified invoices between 29 October and 11 November 2023 was 5% higher year-on-year. The year-on-year turnover growth in the last two 14-day periods fluctuated significantly partly due to the difference in the timing of the last working day before the holidays this year and last year (Monday, 30 October this year). Growth of turnover in trade, which accounted for almost 80% of the total value of fiscally verified invoices, rose again, to 7%, after halving in the previous 14-day period. Year-on-year turnover growth slowed in accommodation and food service activities and certain creative, arts, entertainment, and sports services and betting and gambling (overall growth in accommodation and food service activities and in other service activities fell from 5% to 3%).
Electricity consumption by consumption group, October 2023
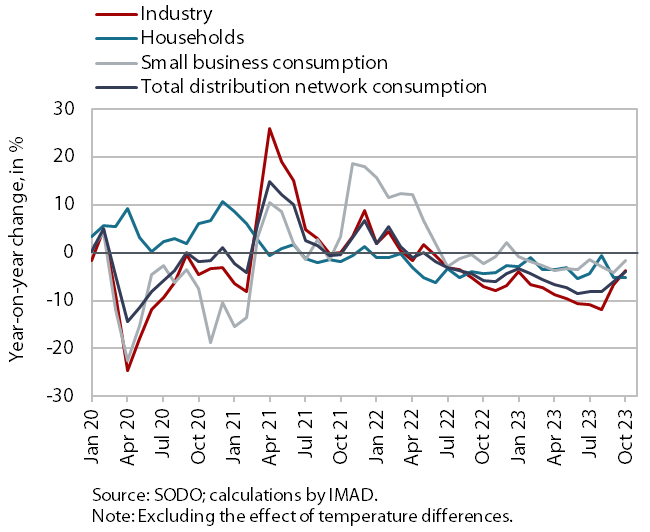
Electricity consumption in the distribution network was lower year-on-year in October, but the decline was less pronounced than in previous months. Industrial consumption recorded a small year-on-year decline (3.7%), which was also due to one more working day this year and last year’s relatively low base. Household consumption fell by 5.1% year-on-year in October, while small business consumption fell by 1.7% year-on-year.
Activity in construction, September 2023

According to data on the value of construction work put in place, construction activity increased in September and remained significantly higher than last year. After a sharp rise at the beginning of the year, activity fluctuated around the high level reached in the following months before rising further in September as a result of the post-flood recovery. Compared with the same period last year, the value of construction put in place rose by 23% in the third quarter. Activity in specialised construction and civil engineering increased by 27% and activity in building construction increased by 13%.
However, some other data suggest significantly lower growth in construction activity. According to VAT data, activity of construction companies in the third quarter increased by 11% year-on-year. Based on data on the value of construction put in place, the difference in the growth of activity was 12 p.p.
Number of persons in employment, September 2023

Year-on-year growth in the number of persons in employment (0.9%) continued to slow in September. This was mainly due to a slowdown in year-on-year growth in construction and a decline in manufacturing. Growth was strongest in information and communication. With the number of Slovenians in employment declining slightly year-on-year, an increase in the number of foreign citizens in employment contributed to the overall year-on-year growth in the number of persons in employment in September. Their share among all persons in employment was 14.6% in September, 0.9 p.p. higher than a year earlier. Activities with the largest share of foreigners are construction (48%), transportation and storage (33%) and administrative and support service activities (27%).
Current account of the balance of payments, September 2023

The current account of the balance of payments recorded a surplus again in the third quarter of this year. This was mainly due to the goods trade balance. Real exports of goods fell significantly year-on-year, imports even more sharply, while the terms of trade improved. We estimate that the quantity fluctuations contributed EUR 445 million to the year-on-year change in the balance of goods trade in the third quarter (EUR 484 million) and the terms of trade contributed EUR 39 million. The surplus in trade in services was lower year-on-year due to a lower surplus in trade in technical, trade-related services. The surplus in trade in transportation and travel was higher year-on-year. The primary income deficit was lower year-on-year in the third quarter, mainly due to lower net outflows of dividends and profits and higher net interest income from assets in debt instruments. The higher secondary income deficit was arising from lower net outflows of private and government sector transfers. The 12-month balance of the current account of the balance of payments showed a surplus of EUR 2.1 billion in September (3.3% of estimated GDP).