Charts of the Week
Charts of the week from 9 to 13 March 2026: manufacturing production, activity in construction and electricity consumption by consumption groups
Manufacturing output increased in January following a decline at the end of last year, but remained lower year-on-year due to weaker performance in high-technology industries. The indicator of expected production in manufacturing has been deteriorating since the end of last year and was also lower year-on-year in February. After strong growth until October last year, the value of construction work put in place has been declining since then; it fell slightly again in January but remained well above the level a year earlier.
Manufacturing production, January 2026
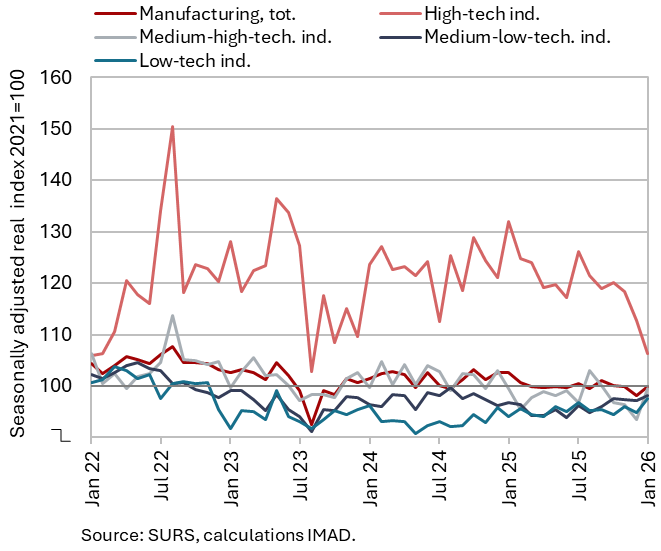
After declining at the end of last year, manufacturing output increased month-on-month in January (seasonally adjusted), though it remained lower year-on-year (–2.4%, working-day adjusted). At the start of the year, production rose in most groups classified by technological intensity. However, output in high-technology industries fell sharply month-on-month (seasonally adjusted) and was also significantly lower year-on-year (returning to levels similar to January 2022). Across individual industries, output was also lower than a year earlier in all energy-intensive sectors, as well as in the manufacture of electrical equipment and in the manufacture of motor vehicles and other transport equipment. After contracting in 2025, production of machinery and equipment increased year-on-year in January, while output of fabricated metal products reached roughly the same level as a year earlier.
After gradually improving in the second half of last year, the confidence indicator in manufacturing deteriorated markedly in February. Since the end of last year, the decline has mainly been driven by the indicator of expected production, which in February was also lower year-on-year.
Activity in construction, January 2026

In January 2025, the value of construction work put in place declined slightly (seasonally adjusted), but remained significantly higher year-on-year (11.6%). After falling at the beginning of 2025, construction activity gradually strengthened over the course of the year, peaking in October, before declining again until January this year (seasonally adjusted). This dynamic – strong growth up to October (22%) followed by a decline to January (-12%) – was mainly driven by developments in civil engineering construction (a 27% increase followed by a 17% decline).
Other data suggest a more moderate dynamic of construction activity. According to VAT data, activity – similarly to the data on the value of construction work put in place – also peaked in October last year, but the increase up to that point was considerably smaller (9%), as was the subsequent decline to January (-9%). Both data sources therefore indicate a similar direction of movement in construction activity, but with different intensity. The divergence between them is not merely methodological; it suggests that assessments of construction activity are sensitive to the choice of data source and therefore subject to uncertainty.
Electricity consumption by consumption groups, February 2026
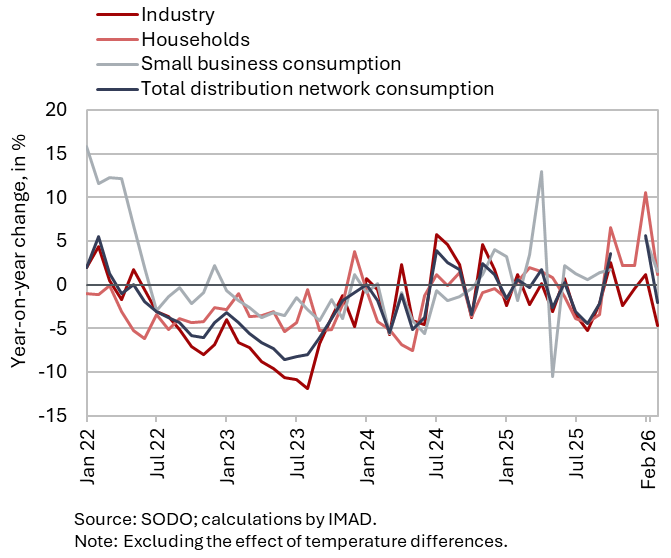
Industrial electricity consumption was lower year-on-year in February. With the same number of working days, it was almost 5% lower than a year earlier. Business electricity consumption increased by 1.5% year-on-year, which may indicate differing trends between the industrial and service sectors of the economy. Household electricity consumption increased by 1.2% year-on-year.