
Charts of the Week
Charts of the week from 24 to 28 August 2026: economic sentiment, turnover in trade, active and inactive population
Economic sentiment deteriorated slightly in August but remained higher than a year earlier and above its long-term average. Real turnover increased in all trade sectors in the second quarter. In the first half of the year, it was lower year-on-year only in the retail sale of food, beverages and tobacco products. According to survey data, both the number of unemployed and employed persons were higher year-on-year in the second quarter. Amid relatively high economic activity, these developments can also be attributed to increased transitions from inactivity into unemployment and employment.
Economic sentiment, August 2026
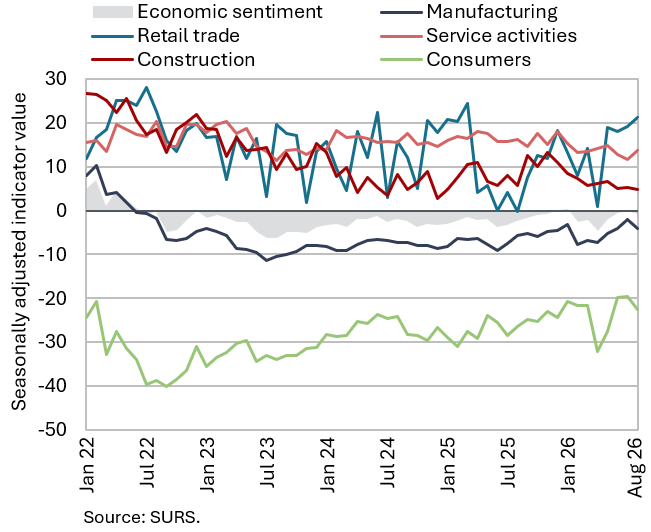
The economic sentiment indicator declined slightly in August, but remained higher year-on-year and above its long-term average. The monthly deterioration in August was driven by lower confidence in manufacturing (particularly by a decline in the expected production indicator) and among consumers. By contrast, confidence improved in services and, to a lesser extent, in retail trade. In construction, where the confidence indicator is furthest above its long-term average, confidence remained unchanged. The confidence indicator in manufacturing remains the only one slightly below its long-term average, although it was also higher year-on-year in August. This year, confidence indicators in services and construction have been lower than a year earlier.
Turnover in trade, June 2026

Real turnover increased in all trade sectors in the second quarter and was higher year-on-year in all sectors except the retail sale of food. Following a decline in the first quarter, turnover increased in the retail sale of food, beverages and tobacco products and, more markedly, in the sale of motor vehicles. In wholesale trade and the retail sale of non-food products, moderate growth continued on average in the second quarter, despite declines in May and June (all seasonally adjusted). Sales were also higher year-on-year in both the second quarter and the first six months, except in the retail sale of food, beverages and tobacco products, where they declined by 1% in the first half of the year. In the first half of the year, year-on-year growth was 7% in the sale of motor vehicles, 3% in wholesale trade and 2% in the retail sale of non-food products.
Active and inactive population, Q2 2026
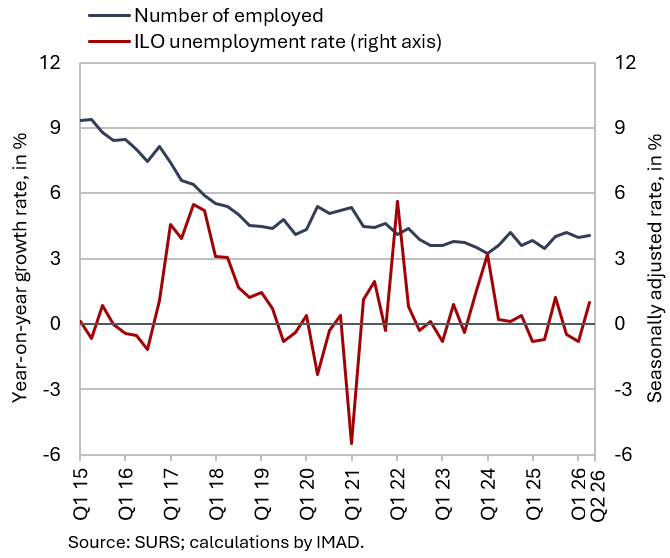
According to survey data, the number of unemployed persons was higher year-on-year in the second quarter, and the number of persons in employment was also slightly higher. The increase in the number of persons in employment was associated with increased transitions from inactivity into both unemployment and employment amid relatively high economic activity. The number of unemployed persons, i.e. job-seekers, reached 39 thousand, 18.2% more than in the second quarter of 2025. The survey unemployment rate (3.8%) was also higher year-on-year (by 0.6 p.p.). In the second quarter of this year, the number of persons in employment was 1% higher year-on-year, with increases in the number of persons in employment relationship and student workers, while the numbers of self-employed persons and unpaid family workers declined.