Charts of the Week
Charts of the week from 16 to 20 June: Slovenian industrial producer prices, electricity consumption by consumption group, number of persons in employment and other charts
The year-on-year growth in Slovenian industrial producer prices remained at 1% in May, with the highest increase still observed in non-durable consumer goods. With one fewer working day this May, industrial electricity consumption, which can serve as an indicator of economic activity, was 3% lower year-on-year. Following a decline at the end of last year, the number of persons in employment remained broadly stable until April (seasonally adjusted). Year-on-year nominal growth in the average gross wage strengthened at the beginning of the year and remained high in April, mainly due to stronger growth in the public sector following the introduction of the new wage system. In the private sector, year-on-year wage growth has moderated slightly. After several years of growth, dwelling prices declined in the first quarter, with their year-on-year growth continuing to slow.
Slovenian industrial producer prices, May 2025
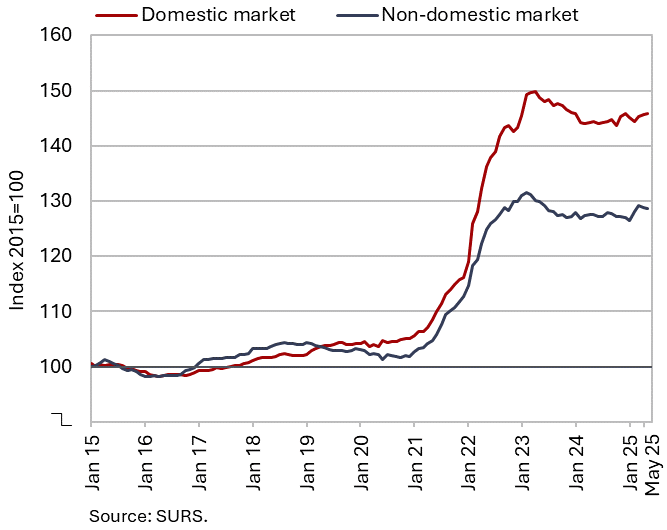
Slovenian industrial producer prices remained unchanged month-on-month in May, while year-on-year growth held steady at 1%, both on the domestic and foreign markets. Year-on-year, the highest increase was again recorded in consumer goods prices (2.7%), although slightly lower than in the previous month (3.0%). Within this group, the increase is driven by higher prices of non-durable goods (3.5%), while prices of durable goods remain lower year-on-year (–0.9%). Year-on-year growth in the prices of intermediate goods has stabilised around 0.5%, while the growth in prices of capital goods was minimal (0.1%). Energy prices, which declined for the second consecutive month on a monthly basis in May, remain lower also year-on-year. However, their decline (–2.0%) more than halved compared with the previous month due to a low base.
Electricity consumption by consumption group, May 2025
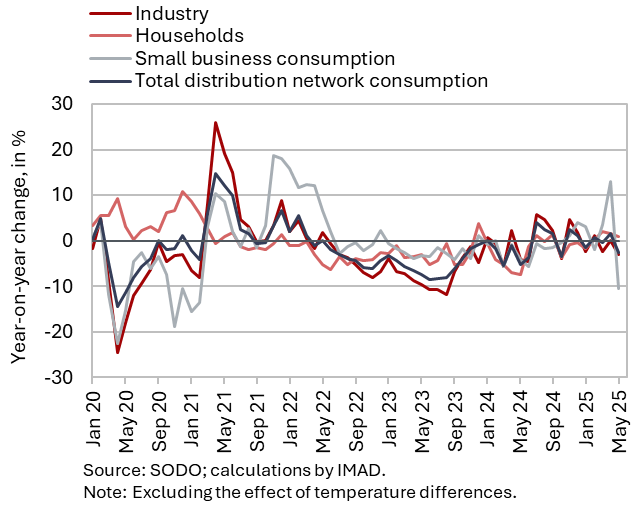
Electricity consumption in the distribution network was 2.6% lower year-on-year in May. With one fewer working day this May, industrial consumption, which can serve as an indicator of economic activity, was 3% lower year-on-year. Household consumption rose by 0.9% year-on-year, while small business consumption – which accounts for only a small share of total consumption – was 10% lower.
Number of persons in employment, April 2025
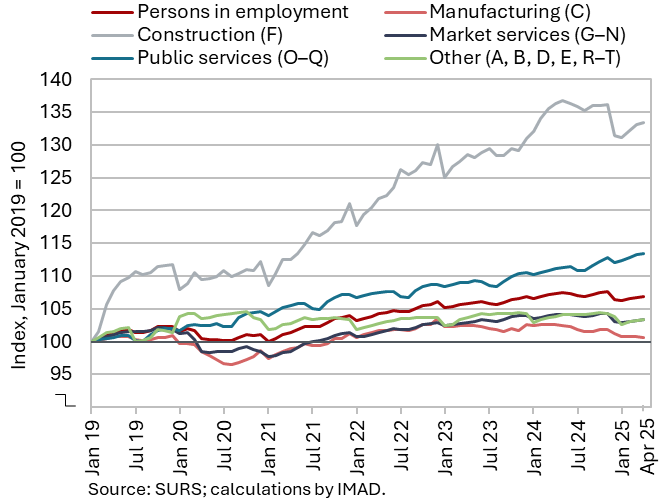
Following a decline at the end of last year, the number of persons in employment has remained broadly stable in recent months (seasonally adjusted). In April, the number of employed persons was 0.4% lower year-on-year. The sharpest decline occurred in administrative and support service activities (-4.8%), mainly due to a decline in employment agencies. The number of employed persons was also noticeably lower than a year ago in construction (–2.1%) and in manufacturing (–2.0%), where labour shortages persist. In contrast, year-on-year growth was observed in public service activities, particularly in human health activities (3.3%) and education (1.7%).
Average gross wage per employee, April 2025
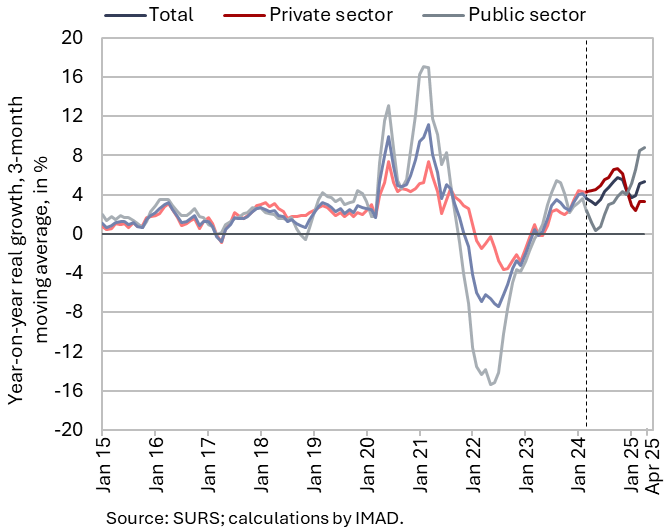
Year-on-year nominal growth in the average gross wage remained high in April (7.4%), particularly in the public sector (11.4%), but also in the private sector, where it moderated somewhat (5.4%). In the public sector, the strong growth is linked to the wage reform including the agreed increase in base wages at the beginning of the year (in the general government sector, which includes most of the public sector), as well as, in recent months, to somewhat stronger wage growth in public companies. In the private sector, growth is, in our assessment, still supported – among other factors – by excess demand for labour in certain parts of the economy, as indicated by a higher job vacancy rate in the first quarter (compared with the previous quarter) and a continued moderate decline in unemployment. In real terms, the average gross wage increased by 5.1% in April – by 3.0% in the private sector and by 8.9% in the public sector.
Real estate, Q1 2025
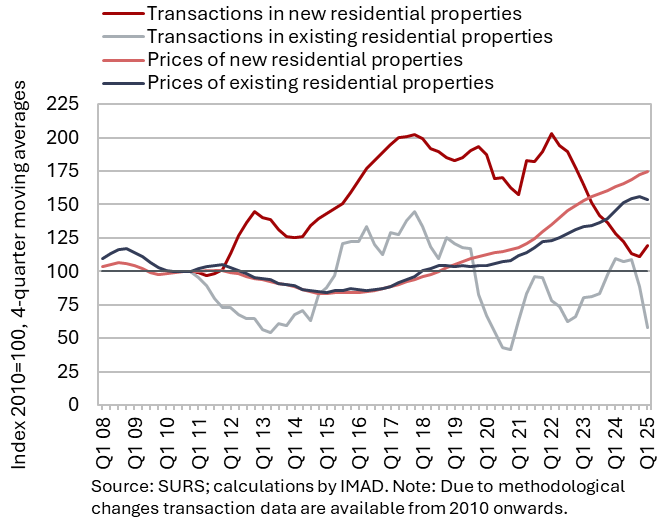
Amid a growth in the volume of sales, the year-on-year growth in dwelling prices moderated further in the first quarter of this year. After an average growth of 7.5% last year, prices were 3.2% higher compared to the first quarter of 2024, but 2.0% lower compared to the last quarter of 2024 – marking the first decline following several years of rising prices. Prices of existing dwellings were 4.8% higher year-on-year. The number of transactions in this segment, following a three-year decline, increased by nearly 30% year-on-year. In contrast, the prices of newly built dwellings declined year-on-year (by 4.8%) and were also lower than in the fourth quarter of 2024 (by 8.8%). The number of their transactions, which only account for a small part of total sales (3%), also fell sharply year-on-year (by three quarters), but their number was relatively high in 2024 according to the revised data.