Charts of the Week
Charts of the week from 11 to 15 March 2024: production volume in manufacturing, activity in construction, current account of the balance of payments and other charts
After manufacturing output had already risen in the fourth quarter of last year, it increased even more strongly in January and was also higher year-on-year in some energy-intensive sectors. The value of construction put in place fell in January and was also down year-on-year. This was the first year-on-year decline in two years. The current account surplus increased further in January, mainly due to goods trade balance. Electricity consumption in the distribution network was lower year-on-year in February, mainly due to year-on-year lower household consumption.
Production volume in manufacturing, January 2024
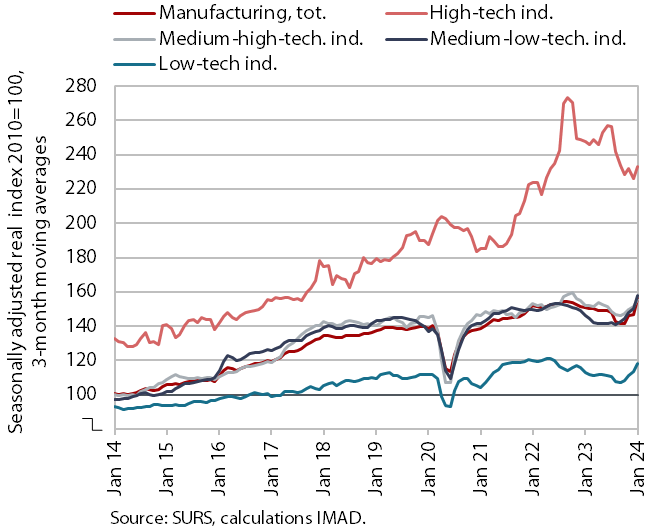
Manufacturing output, which had already risen in the fourth quarter of last year, increased even more strongly in January (seasonally adjusted). With a significant month-on-month recovery it was also higher year-on-year. Last year's levels were most significantly exceeded by the less technology-intensive sectors, where the decline in 2023 was more pronounced. Production in the energy-intensive manufacture of paper and basic metals was also higher year-on-year, while production in the chemical industry and the manufacture of other non-metallic mineral products remained lower year-on-year.
Some other data, however, do not point to such high year-on-year increase in production volume in January (13.6%). Industrial electricity consumption was only 0.7% higher in January than a year earlier. According to data on business trends, orders in manufacturing companies are at a low level and most companies also reported lower production than usual at the beginning of the year. Business expectations regarding production, employment and exports deteriorated further in the first two months of the year (seasonally adjusted).
Activity in construction, January 2024
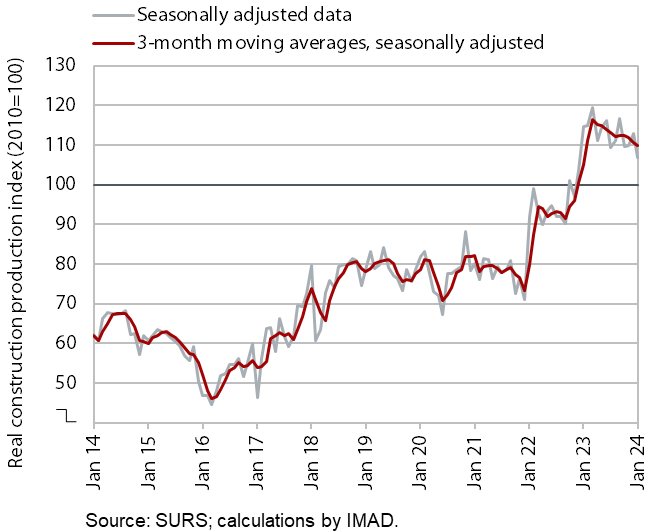
According to data on the value of construction work put in place, construction activity fell in January and was also down year-on-year. After high growth in the value of construction work at the beginning of last year, activity declined gradually amid monthly fluctuations. The value of work put in place was 7% lower than in January last year, which represents the first annual decline in the last two years.
However, some other data point to growth in construction activity. According to VAT data, the activity of construction companies in January was 8% higher than last year. Compared with data on the value of construction put in place, the difference shown in the growth of this activity was thus 15 p.p.
Current account of the balance of payments, January 2024
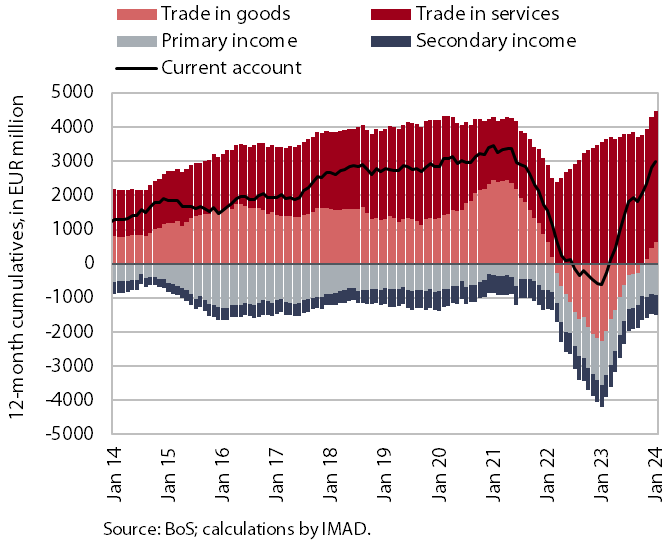
The current account of the balance of payments in the last 12 months recorded a surplus of EUR 3 billion, compared to a deficit of EUR 617.1 million in the same period a year earlier. The main reason for the shift towards a surplus was the goods trade balance, as imports of goods have fallen more sharply than exports. The surplus in trade in services continued to increase, especially in trade in construction services, such as investment works, construction and assembly services and trade in transport services. The primary income deficit was lower mainly due to lower net outflows from equity income (dividends and profits) and higher net interest receipts from abroad. The lower secondary income deficit was arising from lower net outflows of private sector transfers (increased non-life insurance premiums).
Electricity consumption by consumption group, February 2024
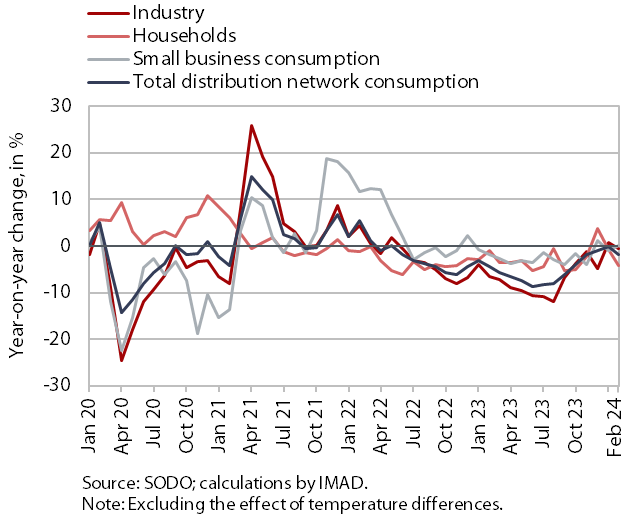
In February, electricity consumption in the distribution network was lower than a year ago. This was mainly due to the year-on-year lower consumption by private households (-4.2%), which, in addition to the different timing of the winter holidays compared to the previous year, could also be due to the lower occupancy of tourist accommodation facilities at the ski resorts, which operated only to a limited extent due to the high temperatures. However, industrial and small business consumption in February were similar to a year ago.